


MyChoice Identifies Ontario Cities Where Drivers Should Exercise Extra Caution
This winter has reminded Ontario drivers just how quickly road conditions can deteriorate. Heavy snowfall, icy highways, and reduced visibility have made driving across the province particularly challenging in recent weeks.
On January 26 alone, Ontario Provincial Police (OPP) officers responded to nearly 200 collisions across the Greater Toronto Area within a 24-hour period. Events like this highlight how vulnerable Ontario’s road network can become during severe weather, and how quickly collisions can accumulate.
In light of these winter driving challenges and ongoing road safety concerns, our team at MyChoice decided to revisit our annual analysis of Ontario’s safest and most dangerous municipalities to drive in.
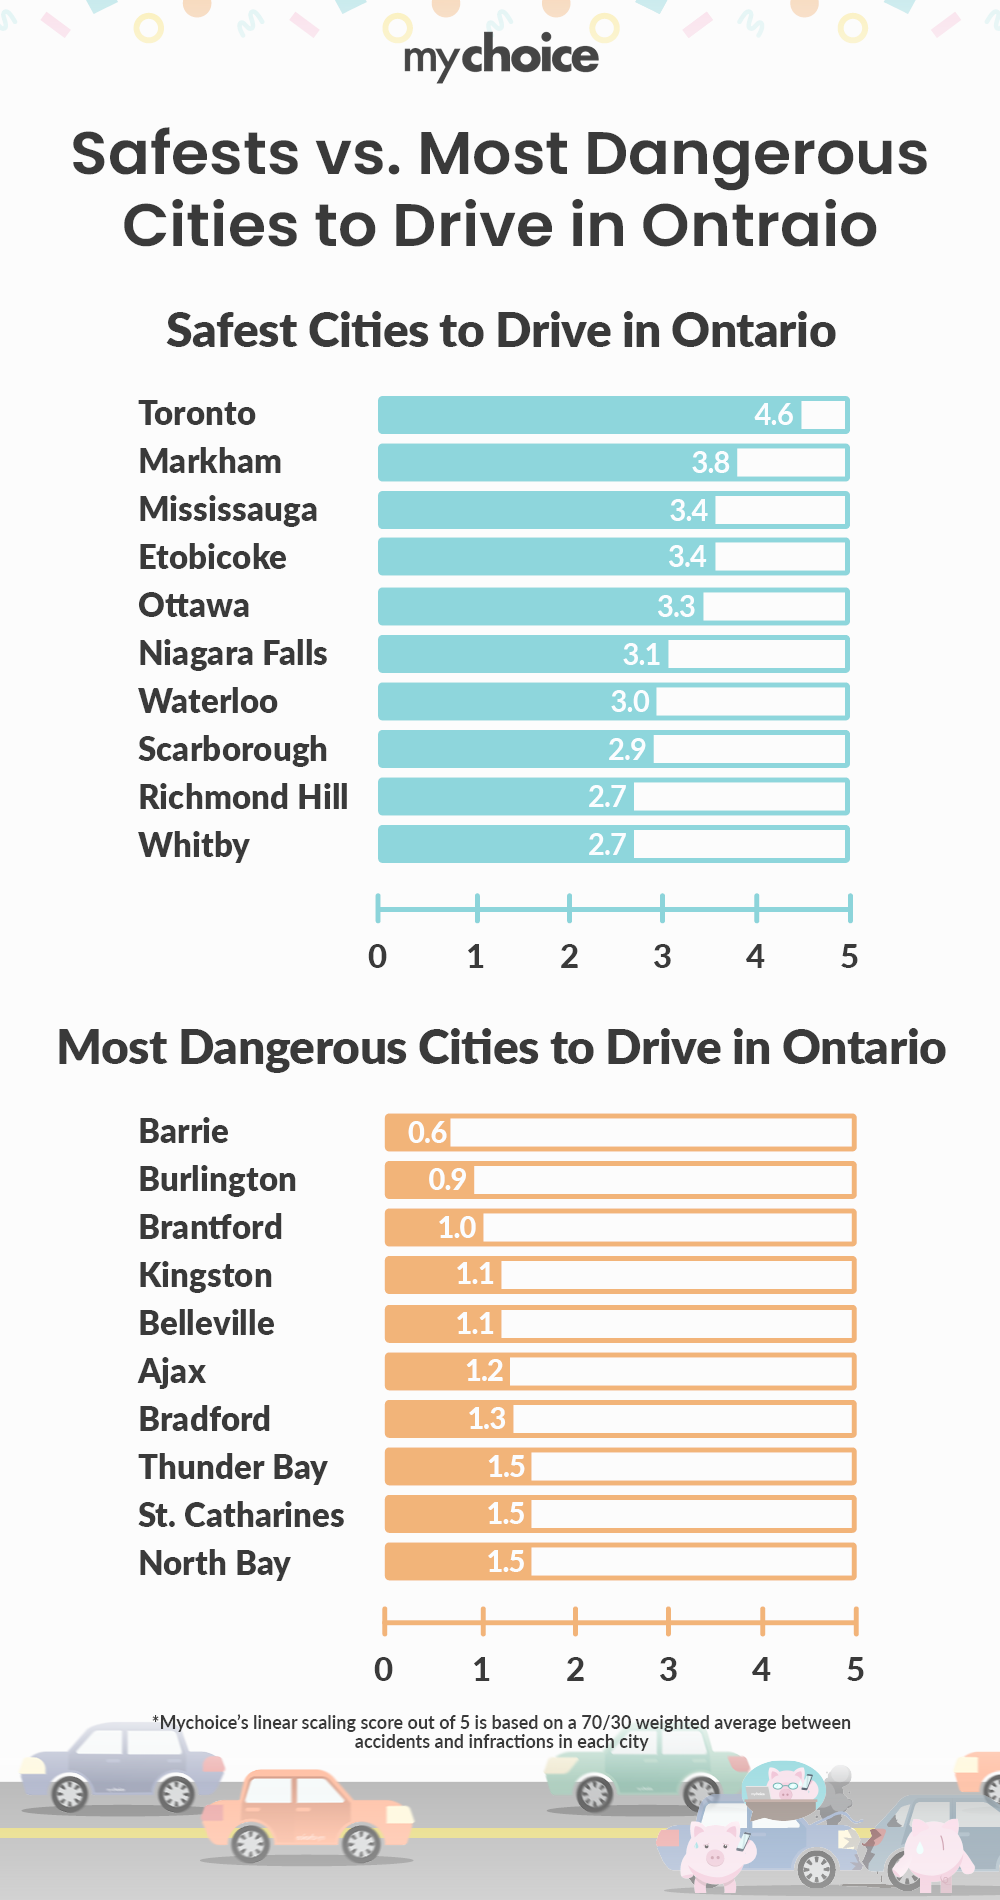
Using over 200,000 car insurance quotes collected through MyChoice.ca since 2020, including detailed accident and infraction records, we updated our rankings to identify where drivers face the highest and lowest levels of risk across the province in 2026. Our methodology is based on the weighted averages of accidents and infractions (i.e. distracted driving, speeding) with a 70/30 importance ratio, creating a comprehensive scoring system from 0 to 5. This approach emphasizes the relative severity of accidents while accounting for traffic violations as a predictive factor for road safety.
Key Findings from the Study
- Toronto continues to rank as Ontario’s safest municipality for driving, earning a score of 4.6 out of 5. As in our previous analysis, the city shows strong alignment between accident rates and driving behaviour indicators. Notably, CBC reported that in 2025, Toronto recorded its lowest number of traffic fatalities in the past decade.
- Barrie now ranks as the most dangerous city to drive in Ontario, replacing Brantford. The change is driven primarily by elevated accident rates rather than infraction spikes.
- Mid-sized cities such as Kingston, Burlington, and Bradford also declined relative to previous years, largely due to sustained high collision rates.
- Brampton’s ranking improved, but it raises questions about potential underreporting of accidents. Brampton’s accident rate appears materially lower relative to its infraction rate, which looks like an anomaly when compared to other cities.
Collision Rates Remain High Across Ontario
While there is some positive dynamic in certain areas, the percentage of drivers with collisions on their record in Ontario has increased from 10.78% in 2024 to 11.06% in 2025, a 0.28 percentage-point rise.
MyChoice CEO Aren Mirzaian provides practical advice for Ontario drivers in light of the findings: “Drivers can’t control the regional risk trends, but they can control how they drive. Following the defensive driving principles, such as leaving extra space, slowing down in poor conditions, and minimizing distractions, remains one of the most effective ways to stay safe on the road. Winter tires are also a smart seasonal upgrade that can qualify you for an insurance discount.”
A single at-fault accident in Ontario can nearly double premiums at renewal.
The Potential Impact of Speed Camera Removal
Another structural change that may influence future rankings is Ontario’s decision to move forward with banning automated speed cameras.
In our most recent analysis on this topic, we found that:
- Cities with high speed camera concentrations (Brampton, Toronto, Mississauga) reported some of the lowest police-issued speeding ticket rates.
- Smaller municipalities with few or no cameras (Brantford, North Bay, Timmins) reported speeding ticket rates nearly double the provincial average.
Although speed camera tickets do not appear on insurance records, their presence may act as a behavioural deterrent.
If municipalities with historically high accident rates begin to show increases in crash volumes or roadside infractions, insurers may revisit how those areas are assessed from a risk perspective.
Final Thoughts
While Ontario’s largest city remains the safest place to drive according to our internal insurance data, several mid-sized municipalities present elevated risk profiles driven primarily by higher accident rates.
By raising awareness of these rankings, MyChoice aims to encourage safer driving habits and promote proactive risk reduction to help Ontario drivers stay safe on the road.
Raw data:
| City | % of Drivers with ≥1 Accident on Record | % of Drivers with ≥1 Infraction on Record |
|---|---|---|
| Barrie | 14.54% | 12.41% |
| Burlington | 14.22% | 11.44% |
| Brantford | 12.30% | 15.13% |
| Kingston | 14.12% | 10.29% |
| Belleville | 12.03% | 15.12% |
| Ajax | 13.28% | 11.72% |
| Bradford | 13.89% | 10.07% |
| Thunder Bay | 12.34% | 12.43% |
| St. Catharines | 12.78% | 11.05% |
| North Bay | 11.42% | 14.19% |
| Hamilton | 12.39% | 11.33% |
| Sarnia | 12.27% | 11.52% |
| Peterborough | 10.77% | 14.62% |
| Sault Ste. Marie | 13.24% | 8.68% |
| Oshawa | 11.75% | 10.95% |
| Sudbury | 11.87% | 10.10% |
| Pickering | 11.34% | 10.99% |
| Brampton | 9.36% | 15.12% |
| Windsor | 11.45% | 9.79% |
| Kitchener | 10.91% | 9.90% |
| Guelph | 10.71% | 10.06% |
| London | 11.51% | 7.89% |
| Milton | 11.07% | 8.78% |
| Oakville | 10.93% | 8.51% |
| Whitby | 10.84% | 8.41% |
| Richmond Hill | 11.37% | 7.04% |
| Scarborough | 9.04% | 11.34% |
| Waterloo | 10.39% | 8.03% |
| Niagara Falls | 9.79% | 8.56% |
| Ottawa | 8.65% | 10.22% |
| Etobicoke | 9.54% | 7.50% |
| Mississauga | 10.00% | 6.29% |
| Markham | 8.35% | 7.99% |
| Toronto | 6.52% | 7.17% |