


MyChoice Publishes New Speeding Ticket Data in Light of Ontario’s Decision to Ban Speed Cameras
As the Ford government pushes ahead with its plan to ban automated speed cameras across Ontario, debate is heating up over whether these devices are a “tax grab” or a vital public safety tool. The proposed legislation, introduced this October, would eliminate the use of speed cameras province-wide and instead encourage the installation of speed bumps and flashing signs.
In light of this major policy shift, our team at MyChoice, a leading insuretech company in Canada, decided to take a closer look at where speeding is most prevalent in Ontario and which cities could be most impacted by the removal of automated enforcement.
Using internal data from nearly 200,000 quotes collected through our insurance comparison platform – MyChoice.ca, from 2020 to 2025, we identified the cities with the highest and lowest reported speeding rates in the province, based on the percentage of drivers who disclosed at least one speeding ticket during the quoting process. It’s important to note that these speeding tickets reflect only those issued directly by police officers to drivers — they do not include speed camera infractions, which typically don’t appear on a driver’s record or affect car insurance. However, this still provides a strong and reliable indicator of driver behaviour across Ontario, allowing us to identify clear speeding hotspots based on reported violations.
Key Findings from the Study
- Over 60% of all traffic infractions in Ontario are related to speeding, making it a major traffic offence in the province.
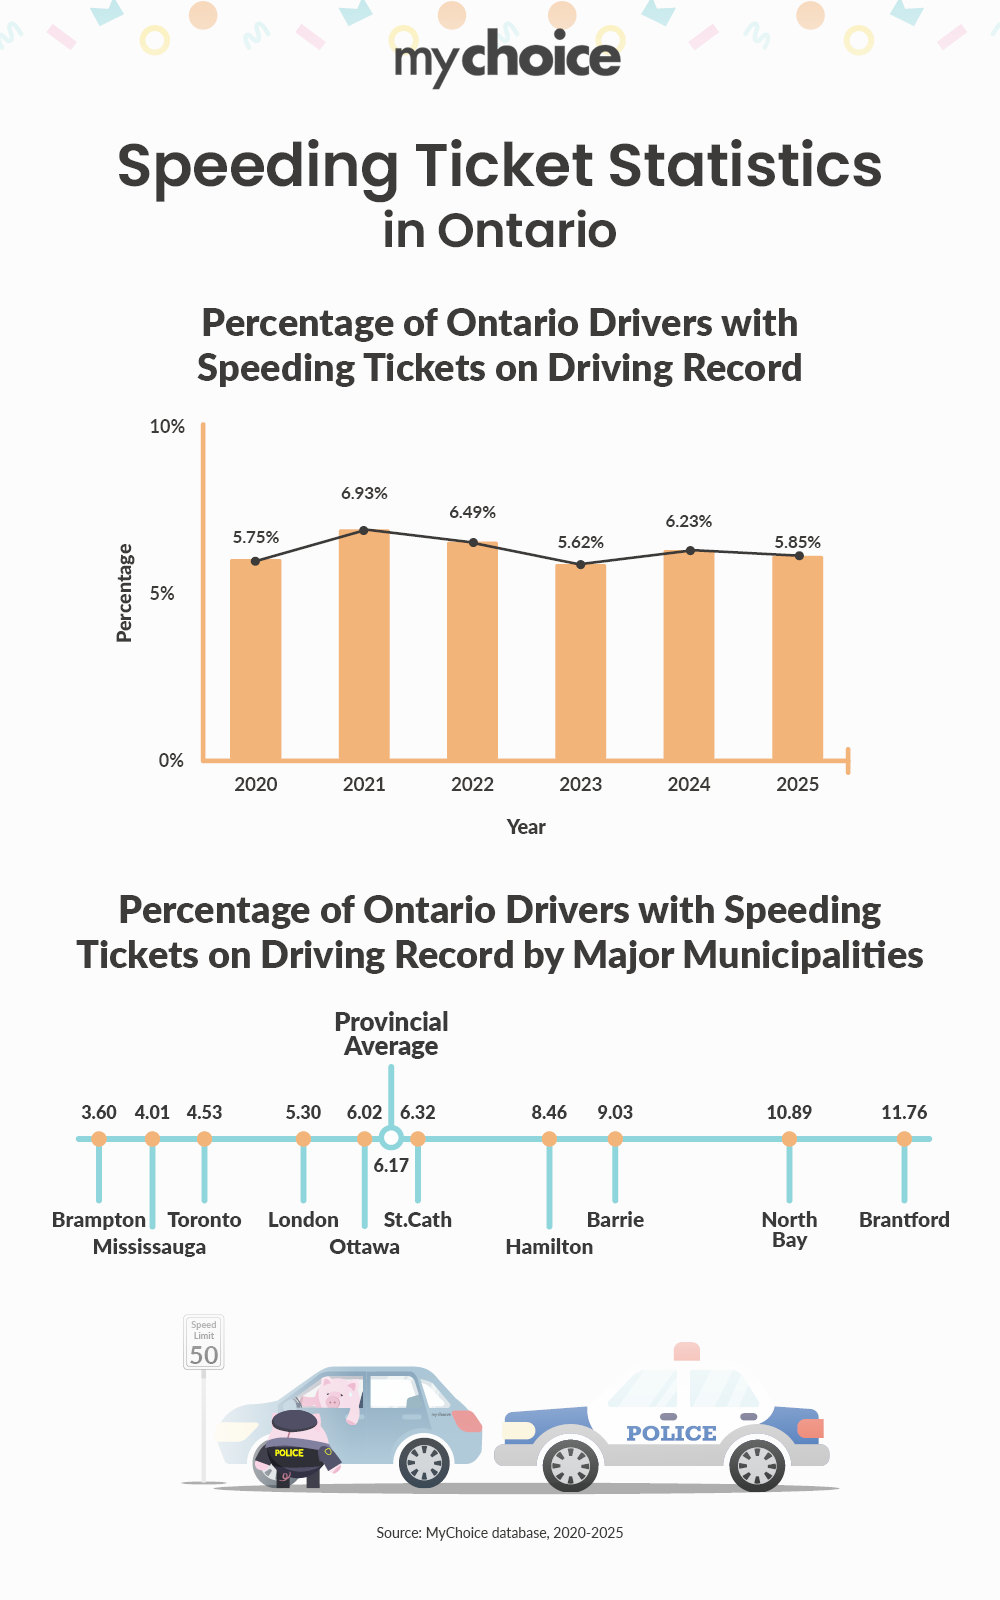
- In 2025, 5.85% of Ontario drivers reported having at least one police-issued speeding ticket on their driving record.
- The percentage of drivers with speeding tickets on record is higher in smaller cities. Cities such as Brantford (11.76%), North Bay (10.89%), and Timmins (10.19%) had the highest share of drivers reporting speeding tickets on their record.
- Brampton, which has 185 speed cameras, reported the lowest rate (3.60%) of drivers with a speeding ticket on record.
- Toronto (4.53%), Mississauga (4.01%), and North York (3.94%) — all cities with more than 20 speed cameras — also fell well below the provincial average.
- Cities with more speed cameras tended to show lower shares of drivers ticketed by police, while those with few or no cameras reported higher rates.
- A single police-issued speeding ticket can lead to an average increase in car insurance of 16.5%. Two tickets raise premiums by 55.8%, while three or more can lead to increases of 80% or higher. Because these infractions stay on record for three years, the financial impact can be long-term.
Where Speeding Cameras Are Concentrated in Ontario
Many of Ontario’s most populous municipalities have installed speed cameras in school zones and high-risk corridors over the past five years. The following table shows the list of Ontario cities with the most speed cameras as of October 2025:
| City | # of Speeding Cameras as of October 2025 |
|---|---|
| Brampton | 185 |
| Ottawa | 60 *(including 19 in Nepean) |
| Toronto | 51 |
| Etobicoke | 36 |
| Scarborough | 36 |
| Kitchener-Waterloo | 28 |
| North York | 24 |
| Mississauga | 22 |
| Newmarket | 14 |
| Oakville | 14 |
Cities with the Highest Speeding Ticket Rates in 2025
The following Ontario cities had the highest percentage of drivers reporting one or more police-issued speeding tickets:
| City | % of Drivers with Speeding Tickets on Record | # of Speed Cameras (Oct 2025) |
|---|---|---|
| Brantford | 11.76% | 0 |
| North Bay | 10.89% | 0 |
| Timmins | 10.19% | 0 |
| Belleville | 10.16% | 4 |
| Innisfil | 10.12% | 2 |
| Peterborough | 9.73% | 2 |
| Sarnia | 9.58% | 0 |
| Chatham | 9.31% | 0 |
| Barrie | 9.03% | 4 |
| Burlington | 8.99% | 6 |
| Ontario Average | 6.17% | – |
Cities with the Lowest Speeding Ticket Rates in 2025
The following Ontario cities have the lowest percentage of drivers with speeding tickets on record:
| City | % of Drivers with Speeding Tickets on Record | # of Speed Cameras (Oct 2025) |
|---|---|---|
| Brampton | 3.60% | 185 |
| North York | 3.94% | 24 |
| Mississauga | 4.01% | 22 |
| Richmond Hill | 4.15% | 4 |
| Scarborough | 4.46% | 36 |
| Toronto | 4.53% | 51 |
| Markham | 4.62% | 5 |
| Nepean | 4.75% | 19 |
| Oakville | 4.85% | 14 |
| Etobicoke | 5.27% | 36 |
| Ontario Average | 6.17% | – |
Could Removing Speed Cameras Actually Raise Insurance Rates?
Beyond traffic safety, Ontario’s move to eliminate speed cameras could have serious ripple effects on insurance premiums — both at the individual and citywide levels. While speed camera tickets do not affect a driver’s record or insurance premiums, the cameras’ presence may serve as a deterrent for some drivers who might otherwise engage in riskier driving behaviour.
MyChoice CEO, Aren Mirzaian, offers his perspective on the topic: “If municipalities with historically high accident rates begin to show increases in crash volumes or roadside infractions, insurers may revisit how those areas are assessed from a risk perspective — potentially influencing how premiums are calculated”.
Additionally, if police enforcement increases to compensate for the absence of speed cameras, drivers may face a new reality — more infractions leading to tickets that directly affect their insurance rates.
Ultimately, this policy change could be a false economy for Ontario drivers — removing speed cameras might save you a fine today, but cost you hundreds more in insurance over the following years.
How Do Speeding Tickets Affect Your Car Insurance Rates?
Even a single speeding ticket issued by a police officer can have a noticeable impact on insurance costs for Ontario drivers. Based on internal MyChoice data, the table below outlines the average premium increases associated with police-issued speeding tickets:
| Number of Speeding Tickets | Average Increase in Car Insurance Premium in Ontario |
|---|---|
| 1 Ticket | +16.5% |
| 2 Tickets | +55.8% |
| 3 Tickets | +80.2% |
This means a single infraction could cost drivers hundreds of dollars more in insurance premiums per year, and repeat offences can make premiums skyrocket.
Final Thoughts: Policy and Risk
The government’s plan to eliminate speed cameras comes at a time when our data shows that speeding is still a serious issue in many parts of the province. Over 60% of all traffic infractions recorded through our platform are speeding-related.
The contrast between cities is stark. Urban centres like Toronto, Brampton, and Mississauga — where camera enforcement is common — have the lowest share of drivers reporting speeding tickets on their record. In contrast, smaller cities with little or no camera coverage, including Brantford and North Bay, show driver speeding ticket rates twice the provincial average.
As municipalities grapple with enforcement strategies and drivers face rising insurance premiums, it’s clear that this policy decision carries more weight than just headlines or ticket revenue. For Ontario drivers, the true cost of speeding may soon show up not just on the road — but on their insurance bills.
Full List of Ontario Cities and Speeding Ticket Rates
| City | % of Drivers with Speeding Tickets on Record |
|---|---|
| Brantford | 11.76% |
| North Bay | 10.89% |
| Timmins | 10.19% |
| Belleville | 10.16% |
| Innisfil | 10.12% |
| Peterborough | 9.73% |
| Sarnia | 9.58% |
| Chatham | 9.31% |
| Barrie | 9.03% |
| Burlington | 8.99% |
| Orillia | 8.97% |
| Bradford | 8.88% |
| Hamilton | 8.46% |
| Aurora | 8.33% |
| Guelph | 8.18% |
| Ajax | 8.14% |
| Oshawa | 8.00% |
| Thunder Bay | 7.96% |
| Stratford | 7.81% |
| Pickering | 7.64% |
| Kingston | 6.80% |
| Welland | 6.73% |
| Cambridge | 6.44% |
| St. Catharines | 6.32% |
| Ontario Average | 6.17% |
| Milton | 6.15% |
| Kitchener | 6.10% |
| Niagara Falls | 6.07% |
| Ottawa | 6.02% |
| Windsor | 5.98% |
| Sudbury | 5.92% |
| Newmarket | 5.84% |
| Whitby | 5.82% |
| Waterloo | 5.68% |
| Sault Ste. Marie | 5.43% |
| London | 5.30% |
| Etobicoke | 5.27% |
| Oakville | 4.85% |
| Nepean | 4.75% |
| Markham | 4.62% |
| Toronto | 4.53% |
| Scarborough | 4.46% |
| Richmond Hill | 4.15% |
| Mississauga | 4.01% |
| North York | 3.94% |
| Brampton | 3.60% |