


MyChoice Identifies Ontario Cities Where Drivers Are Most Likely to Underreport Collisions
As car insurance premiums continue to rise across Ontario (up 4.1% in 2025), drivers are facing tougher decisions every time they’re involved in a collision. With higher deductibles, rising repair costs, and sharp premium increases after at-fault accidents, many Ontarians are quietly weighing whether to report a collision at all.
In light of these growing financial pressures, our team at MyChoice, a leading insurtech company in Canada, analyzed internal insurance quote data to understand better where accident-reporting patterns may be unusual across Ontario municipalities.
Using internal data from nearly 200,000 auto insurance quotes collected through MyChoice.ca between 2020 and 2025, we analyzed the relationship between reported accident history and high-risk driving behaviour (i.e. speeding, failing to yield, careless driving, improper passing, improper lane change, distracted driving, tailgating). The goal was to identify Ontario cities where drivers report unusually low accident rates despite elevated levels of risky driving behaviour, a pattern that may suggest collisions are being settled privately rather than reported to insurers.
Key Findings from the Study
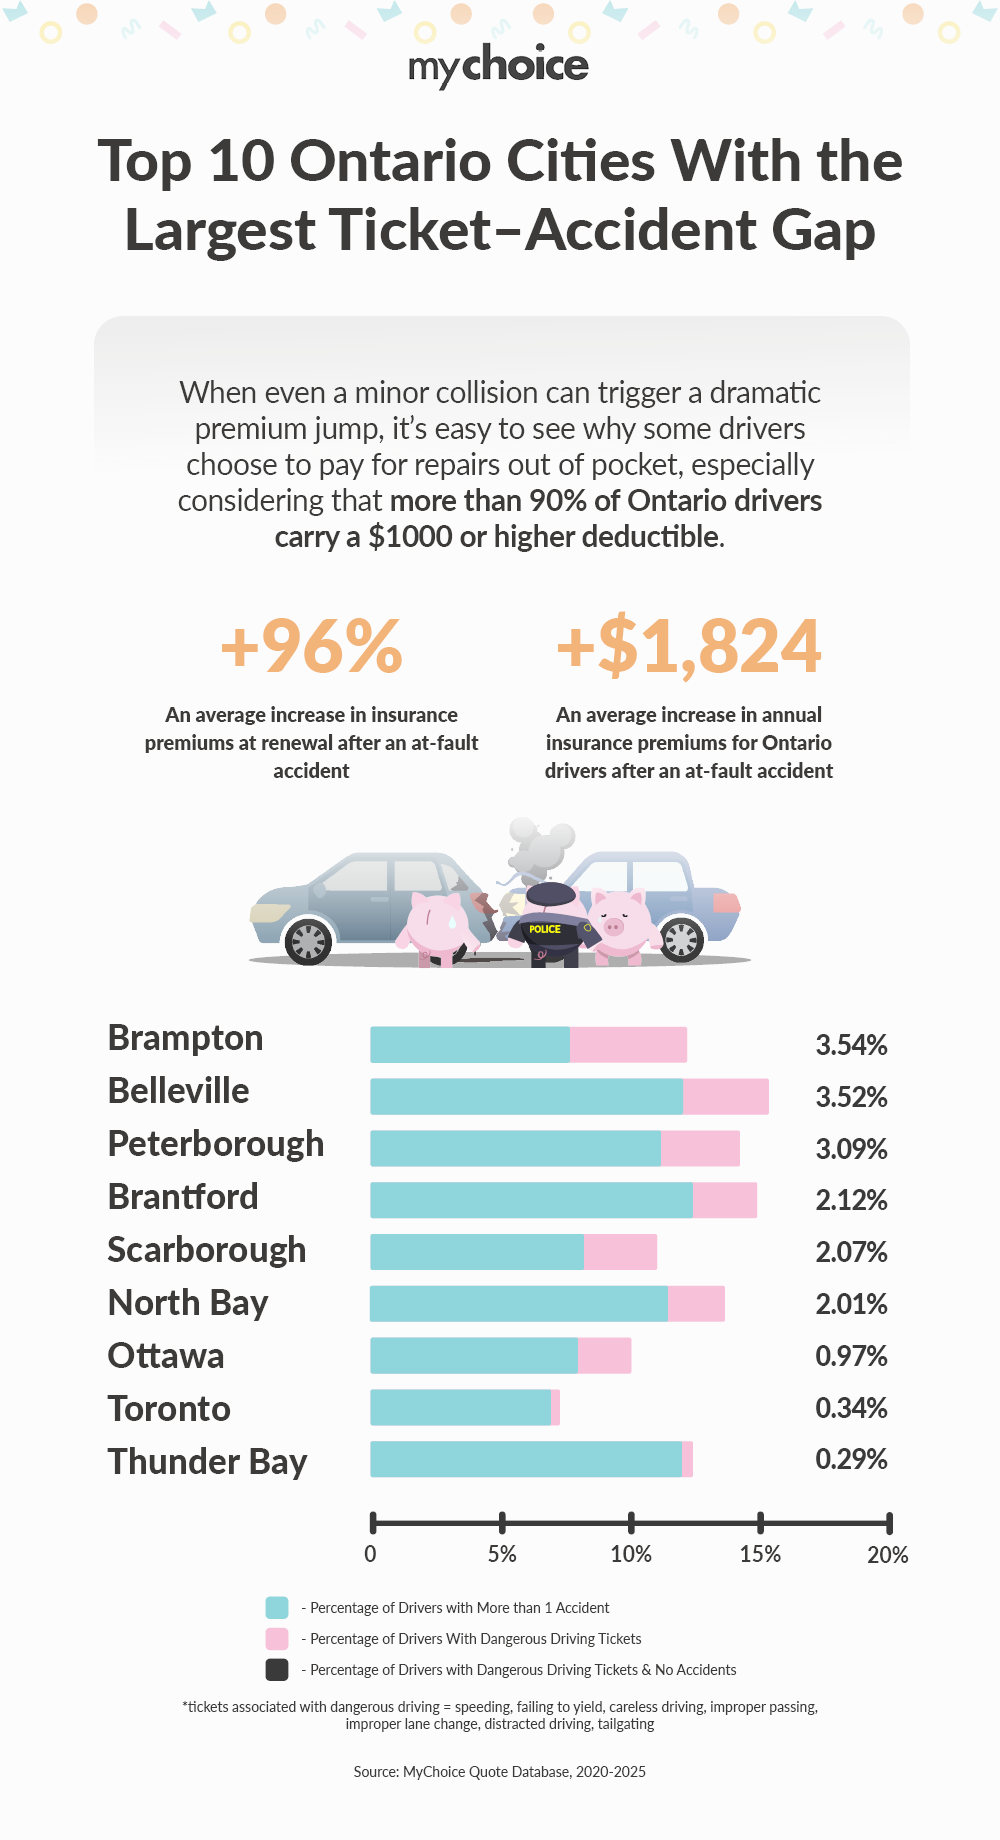
- Ontario drivers see an average 96% increase in car insurance premiums at renewal after an at-fault accident, nearly doubling annual costs.
- With the average Ontario car insurance premium now around $1,900, a post-accident increase can push annual premiums to $3,700 or more, often for multiple years.
- Brampton, Belleville, and Peterborough show the largest gaps between dangerous driving behaviour and reported accidents, suggesting potential underreporting of collisions.
- Several mid-sized Ontario cities, including Brantford, Scarborough, and North Bay, also display notable positive gaps, where risky driving appears to outpace reported accident history.
- Toronto and Ottawa, Ontario’s two largest urban centres, show minimal ticket–accident gaps, indicating that accident reporting more closely aligns with driving behaviour in major metropolitan areas.
- At the other end of the spectrum, cities such as Kingston, Richmond Hill, Mississauga, and Burlington report accident rates significantly higher than dangerous driving ticket rates.
High-risk driving behaviour doesn’t always result in a collision. But when a city consistently shows high rates of dangerous driving tickets paired with comparatively low reported accident rates, it raises a reasonable question: are some drivers choosing not to report collisions?
A positive gap suggests risky behaviour outpaces reported accidents. A negative gap suggests accidents are being reported at higher rates relative to ticketed behaviour.
MyChoice CEO, Aren Mirzaian, explains why this matters: “Areas that show high levels of dangerous driving but unusually low reported accident rates stand out as anomalies. Knowing that at-fault accidents can nearly double premiums, it’s not surprising that some drivers might choose to settle repairs privately instead of reporting a claim.”
While underreporting may make sense for individual drivers in the short term, it creates blind spots in risk assessment that insurers closely monitor over time. If insurers begin to observe discrepancies between traffic enforcement data and claims activity, rating assumptions may eventually be adjusted.
Ontario Cities with the Largest Ticket–Accident Gaps
The following cities show the largest positive gaps, indicating potential collision underreporting:
| City | % of Drivers with ≥1 Accident | % of Drivers with Dangerous Driving Tickets | Ticket–Accident Gap |
|---|---|---|---|
| Brampton | 8.58% | 12.12% | +3.54% |
| Belleville | 12.10% | 15.62% | +3.52% |
| Peterborough | 11.06% | 14.15% | +3.09% |
| Brantford | 12.66% | 14.78% | +2.12% |
| Scarborough | 8.91% | 10.98% | +2.07% |
| North Bay | 11.69% | 13.70% | +2.01% |
| Ottawa | 8.67% | 9.64% | +0.97% |
| Toronto | 6.45% | 6.79% | +0.34% |
| Thunder Bay | 12.09% | 12.38% | +0.29% |
Cities Where Accident Reporting Exceeds Risk Indicators
Some cities showed negative gaps, meaning accidents are reported at rates equal to or higher than dangerous driving behaviour:
These cities report higher accident rates relative to dangerous driving behaviour, suggesting collisions are more likely to be formally reported rather than handled privately.
| City | % of Drivers with ≥1 Accident | % of Drivers with Dangerous Driving Tickets | Ticket–Accident Gap |
|---|---|---|---|
| Kingston | 15.21% | 10.67% | –4.54% |
| Richmond Hill | 11.55% | 7.19% | –4.36% |
| Sault Ste. Marie | 11.41% | 7.60% | –3.81% |
| Mississauga | 9.78% | 6.13% | –3.65% |
| Bradford | 13.89% | 10.42% | –3.47% |
| Burlington | 14.10% | 10.93% | –3.17% |
| London | 11.32% | 8.25% | –3.07% |
| Oakville | 10.90% | 8.14% | –2.76% |
| Waterloo | 10.67% | 8.08% | –2.59% |
| Barrie | 13.65% | 11.39% | –2.26% |
Why Drivers May Choose to Pay Out of Pocket
When even a minor at-fault collision can trigger a sharp premium increase, the financial incentive to avoid filing a claim becomes clear. With the average Ontario auto premium at $1,900, a 96% post-accident increase can add nearly $1,800 per year, often lasting three to six years. By comparison, many bumper and sensor-related repairs cost $1,500–$2,000, and more than 90% of Ontario drivers carry deductibles of $1,000 or higher. In many cases, filing a claim provides limited short-term relief while creating thousands of dollars in long-term insurance costs.
Final Thoughts: Cost Pressure and Behavioural Change
Ontario’s auto insurance market is already under strain, with premiums rising steadily due to inflation, repair costs, and claims severity. As financial pressure increases, driver behaviour changes not only on the road but also in how accidents are handled after they occur.
This study highlights a growing tension between short-term affordability and long-term risk transparency. While paying out of pocket may feel like the rational choice for many drivers today, widespread underreporting can reshape how insurers evaluate regional risk tomorrow.
For Ontario drivers, the true cost of a collision isn’t always visible at the repair shop — it often shows up months later, at renewal time.
Raw Data:
| City | Province | % of Drivers with ≥1 Accident | % of Drivers with Dangerous Driving Tickets | Ticket–Accident Gap |
|---|---|---|---|---|
| Airdrie | AB | 9.31% | 14.28% | +4.97% |
| Brampton | ON | 8.58% | 12.12% | +3.54% |
| Belleville | ON | 12.10% | 15.62% | +3.52% |
| Fort McMurray | AB | 9.02% | 12.27% | +3.25% |
| Peterborough | ON | 11.06% | 14.15% | +3.09% |
| Brantford | ON | 12.66% | 14.78% | +2.12% |
| Scarborough | ON | 8.91% | 10.98% | +2.07% |
| North Bay | ON | 11.69% | 13.70% | +2.01% |
| Red Deer | AB | 13.66% | 14.75% | +1.09% |
| Ottawa | ON | 8.67% | 9.64% | +0.97% |
| Toronto | ON | 6.45% | 6.79% | +0.34% |
| Thunder Bay | ON | 12.09% | 12.38% | +0.29% |
| Grande Prairie | AB | 12.05% | 12.06% | +0.01% |
| Edmonton | AB | 12.08% | 11.86% | -0.22% |
| Niagara Falls | ON | 9.64% | 9.10% | -0.54% |
| Calgary | AB | 11.40% | 10.82% | -0.58% |
| Hamilton | ON | 12.39% | 11.64% | -0.75% |
| Oshawa | ON | 12.00% | 11.21% | -0.79% |
| Guelph | ON | 10.57% | 9.73% | -0.84% |
| Halifax | NS | 4.90% | 3.92% | -0.98% |
| Lethbridge | AB | 12.12% | 11.12% | -1.00% |
| Sarnia | ON | 12.50% | 11.25% | -1.25% |
| Kitchener | ON | 11.32% | 9.93% | -1.39% |
| Markham | ON | 8.74% | 7.34% | -1.40% |
| Ajax | ON | 12.97% | 11.57% | -1.40% |
| St. Catharines | ON | 12.63% | 11.17% | -1.46% |
| St. John’s | NFL | 4.69% | 3.22% | -1.47% |
| Dartmouth | NS | 6.64% | 4.98% | -1.66% |
| Armdale | NS | 6.36% | 4.64% | -1.72% |
| Sudbury | ON | 11.53% | 9.76% | -1.77% |
| Milton | ON | 10.68% | 8.78% | -1.90% |
| Etobicoke | ON | 9.51% | 7.57% | -1.94% |
| North York | ON | 8.34% | 6.25% | -2.09% |
| Windsor | ON | 11.82% | 9.59% | -2.23% |
| Barrie | ON | 13.65% | 11.39% | -2.26% |
| Waterloo | ON | 10.67% | 8.08% | -2.59% |
| Oakville | ON | 10.90% | 8.14% | -2.76% |
| London | ON | 11.32% | 8.25% | -3.07% |
| Burlington | ON | 14.10% | 10.93% | -3.17% |
| Bradford | ON | 13.89% | 10.42% | -3.47% |