








Traffic fatalities increased in Canada between 2019 and 2023, despite widespread seat belt laws. According to Transport Canada, there were 1,620 fatal collisions in 2019, compared with 1,768 in 2023, an increase of approximately 9.14%. Those collisions killed 1,964 people in 2023. Among drivers involved in fatal collisions that year, 32.6% were not wearing a seat belt, up from 25.6% in 2019 — a jump of 7.0 percentage points.
To understand this trend better and deeper, our team at MyChoice, a leading insurance technology company in Canada, decided to have a look at the areas where fatal collisions are trending, cross-reference that with our proprietary data on seatbelt tickets across the country and the local regulations & penalties to see if there is any correlation.
How Fatal Collisions Are Trending Across Canada
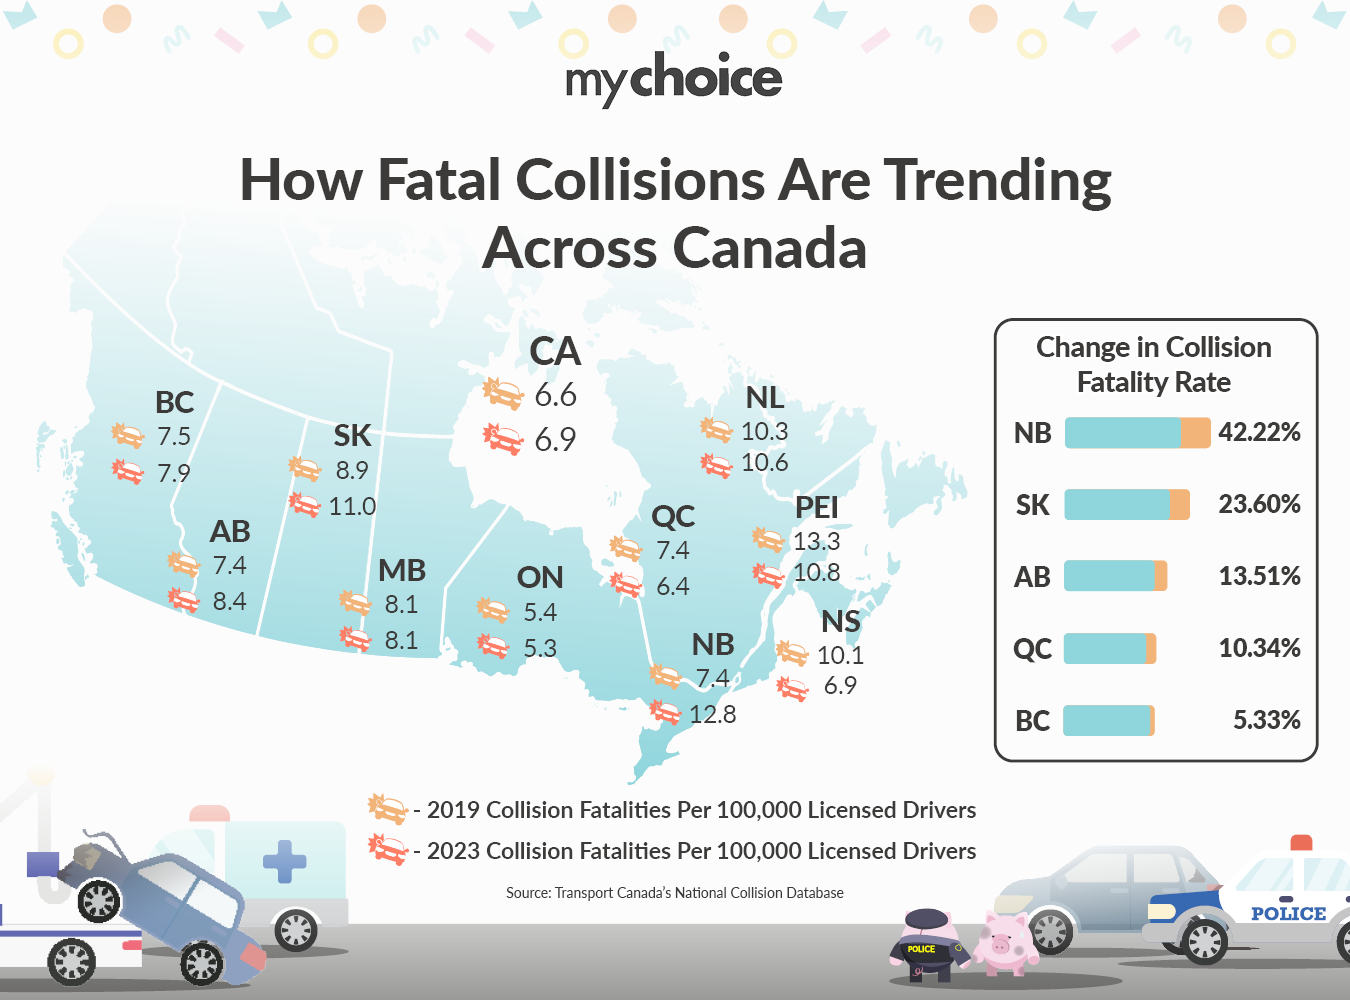
Using the Canadian Motor Vehicle Traffic Collision Statistics reports for 2019 and 2023 (most recent report available), we found that collision-related fatality rates increased in the majority of provinces over the four-year period. Six of Canada’s ten provinces recorded higher fatalities per 100,000 licensed drivers in 2023 than in 2019. New Brunswick experienced the largest increase, up 3.8 fatalities per 100,000 licensed drivers.
In contrast, Nova Scotia saw the most significant improvement, with fatalities declining by 3.2 per 100,000 licensed drivers, while Manitoba’s fatality rate remained unchanged at 8.1 over the same period.

Looking specifically at collisions involving occupants not wearing seat belts, both driver and passenger fatality rates increased between 2019 and 2023. However, the rise was more pronounced among drivers, indicating a growing concentration of fatal outcomes in driver-side non-seat belt collisions.
| 2019 | 2023 | Change | |
|---|---|---|---|
| % of Drivers Involved in Fatal Collisions Where Victims Were Not Using Seat Belts | 25.6% | 32.6% | +7.0% |
| % of Passengers Involved in Fatal Collisions Where Victims Were Not Using Seat Belts | 29.8% | 32% | +2.2% |
Provinces With the Highest Number of Seat Belt-Related Tickets
We can zoom in on how seat belt violations may relate to those outcomes. To do this, we analyzed more than 200,000 auto insurance quotes collected through MyChoice since 2020, focusing on the share of drivers with seat-belt-related tickets on record.
While this dataset covers only five provinces and is not intended to be nationally representative, it offers a useful directional view into how seat belt compliance may align with collision fatality trends.
| Province | Drivers With Seat Belt-Related Infractions on Record (Per 10,000 Drivers) |
|---|---|
| Alberta | 8.3 |
| New Brunswick | 46.4 |
| Newfoundland & Labrador | 76.7 |
| Nova Scotia | 26.9 |
| Ontario | 1.1 |
Newfoundland & Labrador recorded the highest number of drivers with seat belt-related tickets on record per 10,000 drivers, followed by New Brunswick. Ontario, by contrast, had the lowest rate by a wide margin, at just 1.1 per 10,000 drivers.
While this data does not provide a direct, one-to-one link between seat belt violations and collision fatalities, the broader patterns are notable. New Brunswick, which ranks among the highest provinces for seat belt-related tickets in our dataset, also experienced the largest increase in collision fatality rates between 2019 and 2023. Ontario, which had the lowest incidence of seat belt violations on record, saw its fatality rate decline over the same period.
Taken together, the data suggest that seat belt compliance may play a meaningful role in shaping collision outcomes, even if it is only one of several contributing factors.
What Are the Current Seat Belt Laws Across Canada?
We’ve seen how improper seat belt use can influence collision outcomes. Now let’s look at how every province in Canada has seat belt laws in place. We now have one important question: are existing enforcement levels and penalties sufficient to meaningfully change driver behaviour — and reduce fatalities?
| Province | Seat Belt Law Overview | Penalties for Not Wearing Seat Belts |
|---|---|---|
| Newfoundland & Labrador | Mandatory seat belt use for all passengers 16 and over, proper restraints for passengers under 16. | Fine (between $100 and 500) and 2 demerit points. |
| Prince Edward Island | Mandatory for all drivers and passengers at least 16 years of age. Passengers under 16 need to wear seat belts if a seating position is available, and young children must be in an approved child restraint system. | Fine (base amount of $110) and 2 demerit points. |
| Nova Scotia | Everyone in a vehicle at least 16 years of age must wear a seat belt, and the driver is responsible for securing any passengers under 16. | Fine (base amount of $157) and 2 demerit points. |
| New Brunswick | Seat belt requirements for drivers and passengers, with the requirement for adequate secure seating for people under 16. | Fine (base amount of $172.50) and 2 demerit points. |
| Quebec | Mandatory seat belt use for every person in a road vehicle. | Fine (base amount of $115) and 3 demerit points. |
| Ontario | All motor vehicle drivers must wear properly adjusted and fastened seat belts. | Fines (between $200 and $1,000) and 2 demerit points. |
| Manitoba | All drivers and passengers must wear the complete seat belt assembly. | Set fine of $299.65 under Manitoba’s Highway Traffic Act offence schedule. Manitoba has no demerit-point system — a conviction instead moves you down two levels on the province’s Driver Safety Rating scale. |
| Saskatchewan | Drivers and all passengers must wear seat belts if available. Young children are required to be seated on booster seats. | Fine (base amount of $165) and 3 demerit points. |
| Alberta | All drivers and passengers must wear occupant restraints. Learner and probationary drivers may not have more passengers than there are seat belts in the vehicle. | Fine (base amount of $165). |
| British Columbia | Seat belt assemblies must be worn during vehicle operation and children between 6-16 must be properly restrained. | Fine (base amount of $167). |
Fine amounts in this table are the base set fines from each province’s traffic statute — the Highway Traffic Act in Ontario and Manitoba, the Motor Vehicle Act in British Columbia, the Highway Safety Code in Quebec, and their equivalents elsewhere. Court costs and victim surcharges get added on top, so the total on the roadside ticket usually comes out higher.
How Does the Rise of Fatal Collisions Affect Auto Insurance?
The most immediate impact of rising fatal collision rates for policyholders is upward pressure on insurance premiums. As fatal collisions increase, insurers face higher claim volumes and more severe payouts. Over time, this raises the overall risk profile of Canadian drivers, which insurers must account for when setting rates. To offset these growing losses, insurers may increase premiums across the board — even for drivers who have never filed a claim.
Aren Mirzaian, CEO of MyChoice, added, “When fatal collision rates rise, the impact doesn’t stay isolated to the drivers involved. It filters through the entire insurance system. Higher claim severity ultimately affects pricing for everyone, which is why it’s more important than ever for Canadians to actively shop their coverage and understand how their driving profile influences risk.”
While individual drivers can’t control national collision trends on their own, there are still practical steps policyholders can take to protect themselves against future rate increases. Regularly comparing quotes, maintaining a clean driving record, completing defensive driving courses, adjusting deductibles, and reviewing coverage limits can help reduce insurance costs.
Our quoting numbers put a dollar figure on what a single conviction does. In MyChoice quote data, drivers with at least one ticket on record were quoted $4,946 a year on average, against $4,423 for drivers with clean records — nearly 12% more. (Quote-platform data leans toward higher-risk, urban shoppers, so both figures run above market averages; it’s the gap between them that matters here.) A seat belt ticket is a minor conviction, and most insurers look back three years when pricing, so one unbuckled trip can keep costing you across several renewals.
Raw data: Fatalities Per 100,000 Licensed Drivers Across Canada (2019 vs 2023)
| Province | Fatalities Per 100,000 Licensed Drivers – 2019 | Fatalities Per 100,000 Licensed Drivers – 2023 | Change in Collision Fatality Rate |
|---|---|---|---|
| Canada Overall | 6.6 | 6.9 | 4.54% |
| Newfoundland & Labrador | 10.3 | 10.6 | 2.91% |
| Prince Edward Island | 13.3 | 10.8 | -18.80% |
| Nova Scotia | 10.1 | 6.9 | -31.68% |
| New Brunswick | 9.0 | 12.8 | 42.22% |
| Quebec | 5.8 | 6.4 | 10.34% |
| Ontario | 5.4 | 5.3 | -1.85% |
| Manitoba | 8.1 | 8.1 | 0.00% |
| Saskatchewan | 8.9 | 11 | 23.60% |
| Alberta | 7.4 | 8.4 | 13.51% |
| British Columbia | 7.5 | 7.9 | 5.33% |