


Insurance Costs Are Rising Faster in High-Risk Areas and Taking a Bigger Bite Out of Monthly Budgets
Flooding is becoming one of the most financially disruptive climate risks facing Ontario homeowners, and its impact is no longer limited to repair bills after a flood. In July 2024, flash floods across Toronto and southern Ontario caused over $940 million in insured damage, one of the costliest flood events in the province’s recent history.
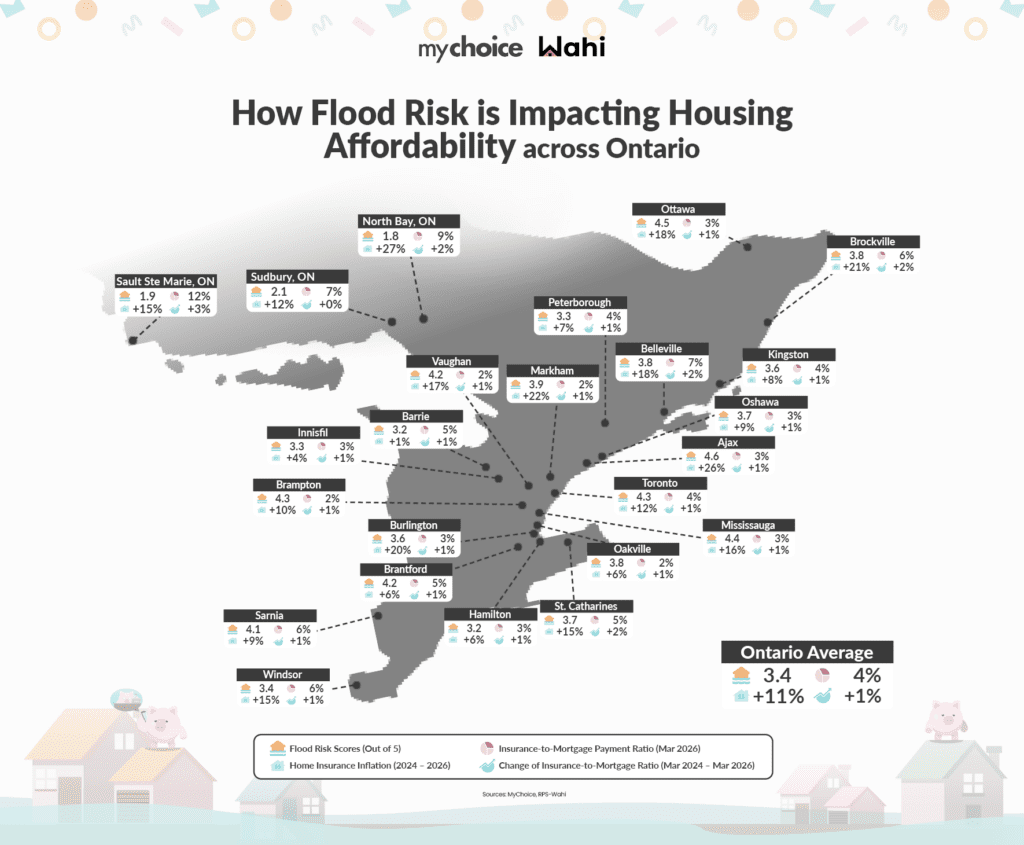
Across Ontario, flood exposure is now being reflected in home insurance premiums, with higher-risk areas seeing faster increases. At the same time, home prices have declined, and mortgage rates have eased, suggesting improved affordability. But beneath the surface, a different trend is emerging. While homes may be cheaper to buy, they are becoming more expensive to own.
In a new joint study, our team at MyChoice partnered with Wahi, one of Canada’s leading real estate platforms, to analyze how flood risk is influencing the true cost of homeownership across Ontario. The analysis builds on our earlier work mapping flood exposure across the province, where we identified the cities most vulnerable to flooding using data from Natural Resources Canada and other federal sources. Each city was assigned a flood risk score on a scale of 1 to 5. By combining those risk insights with the RPS-Wahi Home Price Index data and our insurance datasets, we examined how premiums are evolving in higher-risk areas, and what that means for housing affordability.
Our Methodology
The report examined home insurance premiums across 39 Ontario cities and municipalities, comparing 2024 and 2026 data using a standardized homeowner profile. For consistency, we focused on quotes reflecting a standardized homeowner profile: a 35-year-old male or female with a clean claim history, currently insured, non-smoker, living in a semi-detached or detached 3–4 bedroom home (2,000–2,500 sq. ft.). Each property was assumed to have monitored fire and burglar alarms, at least one fire extinguisher, a $1,000 deductible, $1,000,000 liability coverage, and an Enhanced Water Protection package.
By combining MyChoice’s insurance dataset with Wahi’s RPS Home Price Index, the report quantified how flood risk translates into changes in insurance costs and overall housing affordability pressures across Ontario markets. To illustrate this, the monthly insurance-to-mortgage payment ratio for each city was calculated, factoring in local home values, standard mortgage assumptions (five-year fixed term, 20% downpayment, and prevailing interest rates in 2024 and 2026), and average home insurance premiums — providing a clear picture of how rising insurance costs affect homeowners’ monthly budgets.
Key Findings from the Study
- Ajax (4.6/5), the province’s highest flood-risk city, saw premiums rise 26%, from $1,022 to $1,290. While insurance still represents a smaller share of mortgage payments at 3%, the rate of increase highlights how quickly affordability dynamics can shift in high-risk urban markets.
- Ottawa (4.5), Mississauga (4.4), and Toronto (4.3) also recorded steady premium increases ranging from 12% to 18%. However, higher home values in these markets continue to keep insurance-to-mortgage ratios relatively low, between 3% and 4%.
- Sarnia (4.1), presents a similar pattern, with insurance costs making up 6% of mortgage payments, despite more moderate premium growth (+9%). Brantford (4.2) and Brockville (3.8) also fall into this category, with insurance accounting for 5% to 6% of monthly costs.
- Across Ontario, a clear divide is emerging. In higher-priced markets, rising insurance costs remain diluted by home values. In more affordable markets, particularly those with elevated flood risk, insurance is already taking a significantly larger share of monthly housing costs.
- Northern Ontario presents a different, but equally important trend. While flood risk scores are lower on average, cities such as Thunder Bay, North Bay, and Sault Ste. Marie are seeing some of the fastest premium increases and highest insurance-to-mortgage ratios in the province.
A Growing Influence on Where People Can Afford to Live
While insurance still represents a smaller share of housing costs compared to mortgage payments, the trajectory is clear.
If insurance costs continue to rise, particularly in higher-risk areas, they may begin to influence where Canadians choose to buy homes.
In markets where insurance accounts for a larger share of monthly payments, buyers may face affordability constraints not from the purchase price itself, but from the ongoing cost of protecting their property.
“Affordability isn’t just about what you pay for a home anymore — it’s increasingly about what it costs to protect it,” says Aren Mirzaian, CEO of MyChoice. “What we’re seeing in flood-prone markets is that insurance is becoming a more material part of the monthly cost, particularly in areas that are traditionally viewed as more affordable.”
Flood Risk Challenges: A Look Ahead
Canada is not alone in facing rising insurance costs linked to climate risk. In the United States, flood exposure has already forced a structural shift in how coverage is delivered.
Since 1968, the U.S. has operated the National Flood Insurance Program (NFIP), a federally backed system designed to provide coverage in high-risk areas where private insurers are unwilling or unable to fully absorb the risk. Today, millions of American homeowners rely on the program for access to flood insurance.
The NFIP has helped maintain coverage availability in flood-prone regions, but it has also highlighted the challenges of pricing climate risk. In recent years, the program has begun adjusting premiums to better reflect underlying exposure, leading to higher costs for many policyholders.
In Canada, a comparable national program does not yet exist.
While private insurers began offering overland flood coverage in 2015, a significant portion of high-risk homes still face limited or prohibitively expensive options. To address this gap, the federal government has proposed a national flood insurance program that would work alongside private insurers and target households in the highest-risk areas.
However, progress has been gradual. Despite funding commitments in recent federal budgets and ongoing industry collaboration, the program has yet to be fully implemented as of 2026.
As flood risks continue to grow, the absence of a national backstop may place increasing pressure on both insurers and homeowners, contributing to rising premiums in higher-risk markets and reinforcing the affordability challenges highlighted in this study.
What Homeowners Can Do to Protect Their Homes
Having the right home insurance coverage has never been more important. Beyond coverage, homeowners can take practical steps to reduce their exposure to flood damage and potentially limit long-term costs. Here’s what you can do:
- Install a sump pump with a battery backup to help prevent basement flooding during power outages.
- Improve grading around your home so water drains away, not toward the property
- Seal foundation cracks and window wells to reduce the risk of water intrusion
- Use water-resistant materials in basements, especially in flood-prone areas
- Install smart water leak detection systems, which can alert you early and may qualify for insurance discounts
- Review your policy and add overland water and sewer backup coverage if not already included
Taking these proactive steps, alongside ensuring you have the appropriate insurance coverage, can make a meaningful difference in protecting your home as flood risks continue to rise.
Full Dataset:
| City | Flood Risk Score (5/5) | Avg Home Insurance Premium (2026) | Home Insurance Inflation (2024–2026) | Monthly Insurance Payment as % of Mortgage (2026) | Wahi Home Value Estimate (2026) |
|---|---|---|---|---|---|
| Thunder Bay | 2.6 | $2,264 | 31% | 11% | $396,810 |
| North Bay | 1.8 | $1,713 | 27% | 9% | $403,750 |
| Ajax | 4.6 | $1,290 | 26% | 3% | $883,040 |
| Markham | 3.9 | $1,505 | 22% | 2% | $1,291,740 |
| Brockville | 3.8 | $1,288 | 21% | 6% | $438,400 |
| Burlington | 3.6 | $1,315 | 20% | 3% | $1,009,550 |
| Ottawa | 4.5 | $1,183 | 18% | 3% | $715,330 |
| Belleville | 3.8 | $1,723 | 18% | 7% | $471,820 |
| Vaughan | 4.2 | $1,362 | 17% | 2% | $1,308,820 |
| London | 2.3 | $1,660 | 16% | 5% | $605,800 |
| Mississauga | 4.4 | $1,553 | 16% | 3% | $985,000 |
| Windsor | 3.4 | $1,470 | 15% | 6% | $465,130 |
| St. Catharines | 3.7 | $1,484 | 15% | 5% | $558,330 |
| Sault Ste. Marie | 1.9 | $1,791 | 15% | 12% | $294,380 |
| Chatham | 2.7 | $1,206 | 13% | 6% | $424,450 |
| Toronto | 4.3 | $1,875 | 12% | 4% | $1,042,360 |
| Sudbury | 2.1 | $1,809 | 12% | 7% | $511,160 |
| Brampton | 4.3 | $1,136 | 10% | 2% | $929,050 |
| Orillia | 2.9 | $1,477 | 10% | 5% | $589,040 |
| Sarnia | 4.1 | $1,414 | 9% | 6% | $477,200 |
| Oshawa | 3.7 | $1,195 | 9% | 3% | $755,070 |
| Cornwall | 3.1 | $1,552 | 9% | 8% | $384,330 |
| Cambridge | 2.4 | $1,188 | 9% | 3% | $719,370 |
| Kingston | 3.6 | $1,170 | 8% | 4% | $619,230 |
| Peterborough | 3.3 | $1,244 | 7% | 4% | $574,440 |
| Aurora | 2.7 | $1,553 | 7% | 3% | $1,196,850 |
| Newmarket | 2.8 | $1,373 | 7% | 3% | $957,880 |
| Guelph | 2.1 | $1,363 | 7% | 3% | $787,490 |
| Hamilton | 3.2 | $1,277 | 6% | 3% | $762,200 |
| Brantford | 4.2 | $1,433 | 6% | 5% | $606,050 |
| Oakville | 3.8 | $1,473 | 6% | 2% | $1,437,490 |
| Milton | 2.3 | $1,484 | 5% | 3% | $968,790 |
| Welland | 2.2 | $1,320 | 4% | 5% | $535,330 |
| Kitchener | 2.2 | $1,021 | 3% | 3% | $733,660 |
| Collingwood | 2.0 | $1,118 | 2% | 3% | $697,620 |
| Barrie | 3.2 | $1,757 | 1% | 5% | $700,260 |
| Niagara Falls | 2.5 | $1,373 | 1% | 5% | $586,090 |