







Kelowna, Regina, and Winnipeg top Canada’s 2026 wildfire risk rankings under new federal forecasting model
Wildfires have traditionally been a seasonal hazard impacting the environment. However, wildfires in Canada have become much more complicated socioeconomic issues impacting housing, infrastructure, insurance, and affordability. After the record-breaking 2024 wildfire and natural catastrophe season with losses in excess of $8.5 billion in insured losses nationwide, the insurance industry, homeowners, and policymakers are paying close attention across the country to changes in wildfire risk and catastrophe losses.
At the same time, the science behind wildfire forecasting is changing rapidly. In April 2026, Natural Resources Canada significantly upgraded the Canadian Wildland Fire Information System (CWFIS), introducing a fundamentally new forecasting framework known as Seasonal Forecast 2.0. The updated system now uses CanSIPSv3 ensemble climate modelling, 6-hour gridded weather inputs, expanded spatial coverage, probabilistic forecasting, and new “Extreme Fire Weather Days” forecasting layers to better estimate periods of elevated wildfire danger.
Here at MyChoice, a leading insurtech in Canada, we recently overhauled our methodology for our 2026 annual wildfire study in light of recent changes.
How We Calculated the 2026 Wildfire Risk Index
The 2026 edition of the study uses a completely new methodology based on Natural Resources Canada’s upgraded CWFIS Seasonal Forecast 2.0 system, introduced in April 2026. Because the underlying government forecasting model changed this year, the 2026 rankings are not directly comparable to previous editions of the study.
The Wildfire Risk Index was created by MyChoice and is calculated using two equally-weighted components.
Exposure indicators include Natural Resources Canada (NRCan) fuel types and wildland-urban interface mapping, provincial wildfire exposure assessments and wildfire occurrences from Natural Resources Canada’s National Fire Database (NFDB), and publicly available housing data. Additional considerations include evacuation routes, the ability to access fires to fight them, and census-based growth from Statistics Canada.
Key Findings from the Study
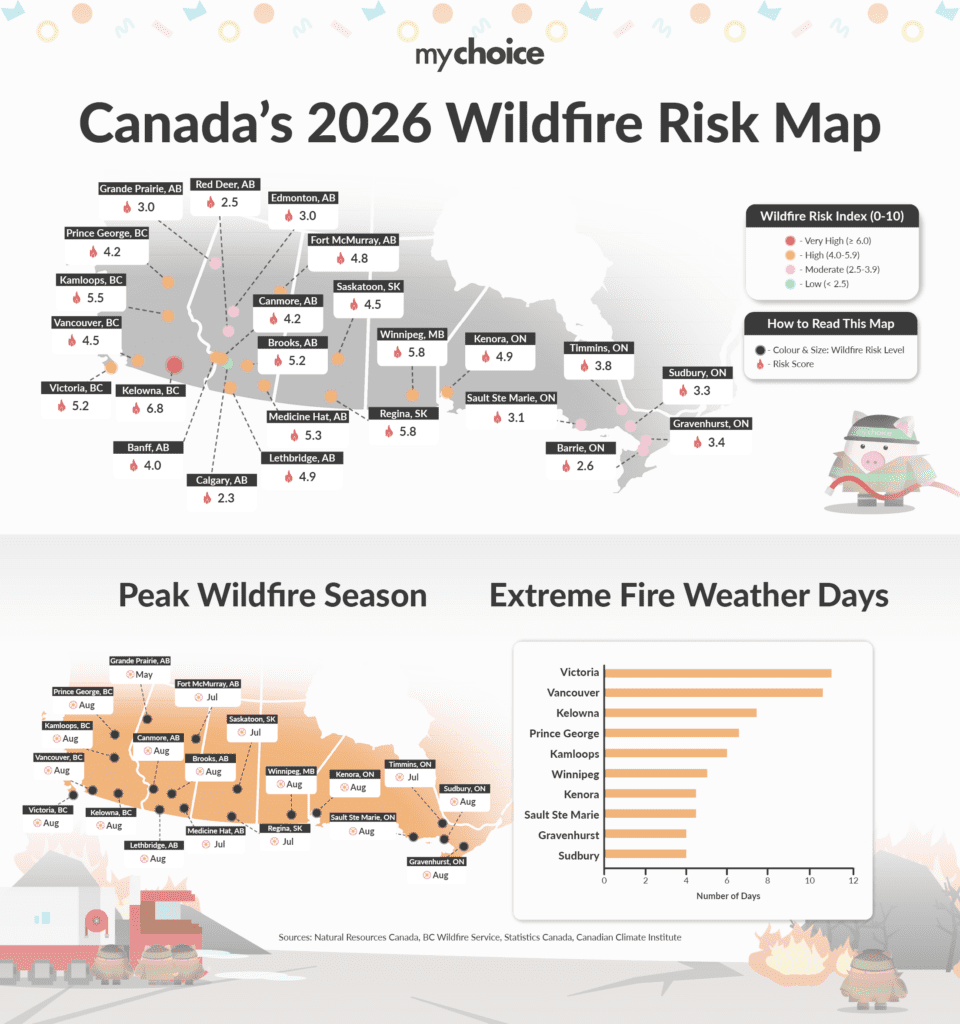
- Kelowna, BC ranked as Canada’s highest overall wildfire-risk city in 2026, posting a Wildfire Risk Index score of 6.8/10. While Prairie cities recorded more severe forecast fire weather conditions, Kelowna’s extremely high community exposure, driven by dense wildland-urban interface (WUI) development, surrounding forest fuel, and historical wildfire activity, pushed it to the top overall.
- Prairie cities are forecast to experience Canada’s most severe fire-weather conditions this summer. Regina (9.8/10) and Winnipeg (9.6/10) recorded the country’s highest Forecast Fire Weather Severity scores, followed by Medicine Hat, Brooks, Lethbridge, and Saskatoon, reflecting projected drought, heat, and elevated grassfire conditions across the Prairies during the 2026 fire season.
- Some of the highest forecasts for Extreme Fire Weather Days in Canada were seen in Victoria and Vancouver. Victoria is predicted to have the highest number, with 11 during its peak in August. Following closely behind is Vancouver, with 10.5 forecast extreme days, which is high considering its more moderate wildfire severity scores.
- Factors such as difficulty of evacuation, past proximity to wildfires and a large number of residences in the wildland-urban interface (WUI) all contributed to some of Canada's most at-risk communities being Kamloops, Fort McMurray, Canmore and Banff, all of which scored extremely highly for community exposure, because of their proximity to dense forests.
- Fort McMurray stood out as one of the study’s biggest contrasts between weather severity and exposure. Although CanSIPSv3 projects relatively low wildfire-weather severity for Fort McMurray in 2026, the city still ranked among Canada’s highest-risk communities because of its extreme structural exposure and history of catastrophic wildfire losses.
- Ontario communities remained moderate overall, but Northern Ontario exposure continues to stand out. Kenora ranked as Ontario’s highest wildfire-risk city at 4.9/10, while Timmins, Sudbury, Gravenhurst, and Sault Ste. Marie also recorded elevated exposure scores due to forest proximity, remoteness, and wildfire accessibility challenges.
- The 2026 results show two very different wildfire patterns in Canada. While prairie cities face the worst forecasted fire-weather in the country this season, many British Columbia and Alberta communities remain highly ranked because of long-term risk factors, namely, growth in the wildland-urban interface (WUI) as a result of development in forested areas.
“Wildfire risk is increasingly becoming a structural issue rather than simply a seasonal one,” Aren Mirzaian, CEO and co-founder of MyChoice, said. “What this year’s study really shows is that atmospheric fire weather is only part of the equation. Communities with dense development near forested areas, expensive housing stock, and limited evacuation flexibility may remain vulnerable even during seasons where forecast fire conditions appear moderate.”
“Homeowners should think proactively about mitigation. FireSmart-style home hardening, clearing combustible vegetation, maintaining defensible space around structures, and reviewing insurance coverage limits can make a meaningful difference. We’re entering an era where wildfire resilience will increasingly shape both affordability and insurability across parts of Canada.”
Why Wildfire Exposure Matters for Homeowners
But a map of financial risk looks considerably different, as wildfire is an increasing financial threat to homeowners, even in communities where flames didn’t reach.
Rebuilding costs continue to rise
Reconstruction costs after a disaster commonly exceed pre-fire property values. Reasons for price increases include:
- labour shortages,
- material inflation,
- contractor demand surges,
- and infrastructure disruption.
In high-value communities like Canmore and Kelowna, rebuilding costs after a catastrophic event can escalate rapidly, particularly when large portions of the local housing stock are damaged simultaneously.
Smoke exposure is becoming a national issue
Smoke from wildfires has started reaching areas beyond Western Canada.
Communities like Vancouver and Victoria have seen increases in the duration of smoke exposure in recent years as have Barrie and Sudbury from more remote fires. Health Canada says there is no threshold at which some of the pollutants in wildfire smoke are considered safe and that can have negative effects on respiratory health.
Insurance affordability pressures are growing
Our previous joint study with Wahi found that home insurance costs are already rising significantly in several wildfire-prone Canadian communities, with insurance payments accounting for as much as 19% of monthly mortgage costs in some markets.
As wildfire exposure continues to increase, homeowners in high-risk communities may face:
- rising premiums,
- higher deductibles,
- stricter underwriting,
- One outcome is reduced coverage availability over time.
In areas subject to wildfires, from Kelowna and Kamloops to Fort McMurray to parts of Northern Ontario, affordability of insurance is becoming a major, not minor, part of the cost of homeownership.
Evacuation and displacement risks are increasing
The risks associated with wildfires extend beyond direct property damage.
Mandatory evacuations can result in:
- weeks of displacement,
- hotel and rental expenses,
- lost income,
- transportation disruption,
- and long-term housing instability.
Communities with constrained evacuation infrastructure, particularly remote Northern or mountain communities, may face compounding risks during fast-moving wildfire events.
Global Climate Signals Continue to Raise Concern
Still a cause for concern is the overall climate related to this year’s 2026 wildfire season.
Global ocean temperatures remain near record highs, with NOAA and Copernicus reporting some of the warmest sea-surface temperatures ever recorded entering 2026. Researchers increasingly believe these oceanic conditions may influence atmospheric blocking patterns, drought persistence, and extreme heat events across North America.
Natural Resources Canada emphasizes the importance of interpreting the seasonal wildfire forecast within the context of larger-scale teleconnection patterns
- ENSO,
- the Pacific Decadal Oscillation (PDO),
- and large-scale drought indicators.
While these climate patterns do not directly determine whether a specific city will experience wildfire activity, they contribute to the broader environmental conditions that can increase the likelihood of severe fire-weather episodes.
Raw Data:
| City | Forecast Fire Weather Severity (0–10) | Community Exposure (0–10) | Wildfire Risk Index (0–10) | Extreme Fire Weather Days (Peak Month) |
|---|---|---|---|---|
| Kelowna, BC | 5.8 | 7.8 | 6.8 | 7.5 |
| Regina, SK | 9.8 | 1.8 | 5.8 | 3.0 |
| Winnipeg, MB | 9.6 | 2.0 | 5.8 | 5.0 |
| Kamloops, BC | 3.1 | 7.8 | 5.5 | 6.0 |
| Medicine Hat, AB | 8.7 | 2.0 | 5.3 | 2.5 |
| Brooks, AB | 7.5 | 2.9 | 5.2 | 3.0 |
| Victoria, BC | 5.8 | 4.6 | 5.2 | 11.0 |
| Lethbridge, AB | 7.6 | 2.2 | 4.9 | 3.0 |
| Kenora, ON | 3.6 | 6.2 | 4.9 | 4.5 |
| Fort McMurray, AB | 1.0 | 8.6 | 4.8 | 0.0 |
| Saskatoon, SK | 7.2 | 1.9 | 4.5 | 2.0 |
| Vancouver, BC | 4.8 | 4.2 | 4.5 | 10.5 |
| Prince George, BC | 2.3 | 6.2 | 4.2 | 6.5 |
| Canmore, AB | 0.8 | 7.6 | 4.2 | 1.5 |
| Banff, AB | 0.8 | 7.3 | 4.0 | 1.5 |
| Timmins, ON | 1.5 | 6.1 | 3.8 | 3.0 |
| Gravenhurst, ON | 1.5 | 5.3 | 3.4 | 4.0 |
| Sudbury, ON | 1.6 | 5.1 | 3.3 | 4.0 |
| Sault Ste. Marie, ON | 1.7 | 4.4 | 3.1 | 4.5 |
| Edmonton, AB | 2.3 | 3.8 | 3.0 | 1.5 |
| Grande Prairie, AB | 1.2 | 4.7 | 3.0 | 0.0 |
| Barrie, ON | 1.5 | 3.8 | 2.6 | 4.0 |
| Red Deer, AB | 2.1 | 3.0 | 2.5 | 2.0 |
| Calgary, AB | 1.8 | 2.8 | 2.3 | 1.5 |