


Cities With Older Homes Are Seeing Up to Double-Digit Home Insurance Increases
Canadian homes are getting older, costlier to repair, and more expensive to insure, and in many regions, all three forces are converging.
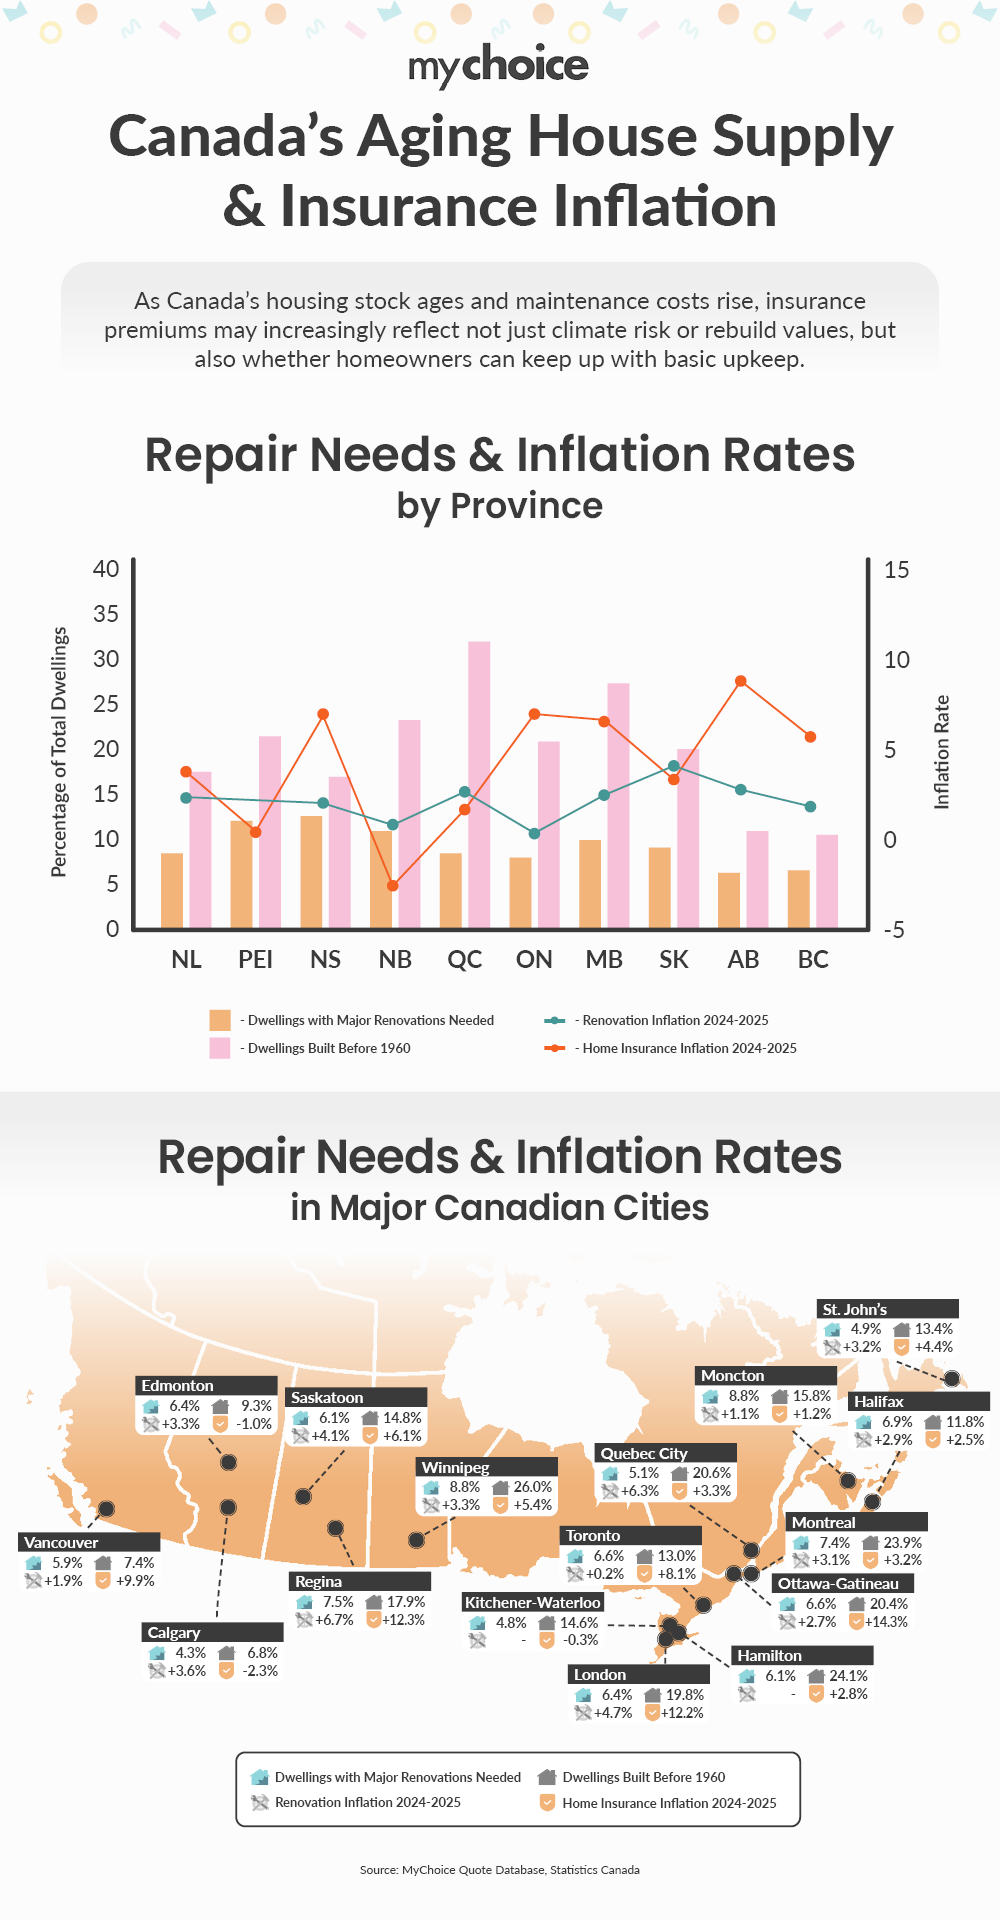
While rising premiums are often linked to climate risk or rebuild costs, this MyChoice study aims to analyze whether deteriorating housing stock may be an underappreciated driver of insurance inflation. Using public housing data, regional renovation cost trends, and our proprietary insurance quote data, we examined how housing condition and repair affordability intersect with insurance pricing across the country.
Our Methodology
This report draws from multiple datasets to assess how aging and poorly maintained homes are affecting insurance pricing across Canada.
- Census housing data from Statistics Canada was used to quantify the share of homes requiring major repairs and the percentage of homes built before 1960, by province and major metropolitan area.
- Renovation cost trends were sourced from Statistics Canada’s Residential Renovation Price Index, tracking renovation inflation between Q3 2024 and Q3 2025 across 15 major Canadian cities.
- Home insurance inflation data was based on thousands of real homeowner quotes generated through MyChoice between January and June 2025 and compared with the same period in 2024. To ensure consistency, we used a standardized homeowner profile: a 35-year-old non-smoker with a clean claims history, insuring a detached or semi-detached 3–4 bedroom home (2,000–2,500 sq. ft.), equipped with monitored fire and burglar alarms, a fire extinguisher, $1,000 deductible, $1,000,000 in liability coverage, and Enhanced Water Protection.
This multi-source approach allowed us to identify cities and provinces where structural home risks, renovation affordability, and insurance cost pressures are intersecting most sharply.
Key Findings from the Study
- Homeowners in Regina, London, and Ottawa face the greatest financial strain. These cities have a high rate of homes needing repairs, sharp increases in renovation costs, and double-digit insurance inflation.
- In Regina, for example, renovation inflation surged by 6.74%, insurance premiums rose by 12.28%, and 7.45% of homes require major repairs.
- In Ottawa, insurance premiums increased by 14.3%, with 1 in 5 homes being built before 1960 and 6.60% of houses requiring major renovations.
- Winnipeg and Montreal both have aging house stock and high repair needs. In Winnipeg, over 26% of homes were built before 1960 (the highest in the country), with 8.81% of homes needing major repairs and rising renovation costs (+3.29%). Montreal shows a similar pattern, with aging homes (23.89%) and high renovation needs (7.38%).
- London’s housing situation is also getting worse. With nearly 20% of homes built before 1960, 6.36% needing major repairs, and renovation inflation nearing 5%, London homeowners are being hit from all angles. Insurance premiums rose 12.15% in 2025, one of the highest in the country.
- Quebec City and Saskatoon experience the largest increases in renovation inflation. Quebec City (+6.29%) and Saskatoon (+4.13%) are experiencing a steep rise in renovation costs, suggesting a growing barrier to home maintenance.
- Toronto and Vancouver appear to have more stability. These markets have newer housing stock and relatively low renovation inflation, which may help cushion the blow. But even here, insurance premiums are still trending upward, with Toronto at +8.12% and Vancouver at +9.94% in 2025.
- Homeowners in High-Risk Cities Should Prepare for Budget Pressures. In cities where aging infrastructure, costly repairs, and a rising risk of weather-related disasters are accelerating (i.e. Regina, Winnipeg and Saskatoon), homeowners may face escalating financial pressures just to maintain and insure their homes.
Older Homes, Deferred Repairs, and Rising Costs: A National Overview
Some provinces have large inventories of aging or deteriorating homes, and the cost to repair them is only rising. Nova Scotia, New Brunswick, and Quebec lead the country in the share of homes needing major repairs, with over 9% of all dwellings flagged as requiring substantial work. In Winnipeg, for example, more than 1 in 4 homes were built before 1960, and nearly 9% are in major renovations.
At the same time, renovation inflation is accelerating. Regina leads the country with a 6.74% year-over-year increase in renovation costs, followed by Victoria (6.24%) and Quebec City (6.29%). When renovation becomes unaffordable, repairs are delayed — and that can mean more insurance claims, higher risk, and rising premiums.
How This Affects Insurance Premiums
Insurers price risk based on many variables, but the condition of the home itself is increasingly coming into focus. In older homes with outdated plumbing, wiring, or structural issues, claims for water damage, fires, and system failures are more likely. If those homes are in areas where renovation inflation is also climbing, the result is a squeeze: homeowners are less likely to fix issues, while insurers are more likely to raise rates to reflect rising risk.
“Older homes with deferred maintenance pose higher risks for things like water damage, electrical fires, or structural failure,” says Aren Mirzaian, CEO of MyChoice. “And when the cost of repairs goes up, homeowners may delay fixing things — which increases risk and ultimately pushes premiums higher.”
Why It Matters
As Canada’s housing stock ages and maintenance costs rise, insurance premiums may increasingly reflect not just climate risk or rebuild values, but also whether homeowners can keep up with basic upkeep.
If renovation costs continue to rise and more households defer maintenance, insurers may face higher claim volumes, and communities could see growing disparities in coverage affordability.
Cities with aging homes and rising insurance rates may require targeted renovation incentives, public maintenance grants, or insurer-backed retrofit discounts to avoid falling into a high-cost trap.
At MyChoice, we’ll continue to monitor how home condition affects risk and pricing because for many Canadians, keeping a home insurable is becoming just as important as keeping it livable.
What Can Homeowners Do To Keep Their Costs Down
If you own a house that is 50+ years old, insurers are increasingly looking at its condition when pricing your premium. Here are some practical ways you can stay ahead:
- Tackle Small Repairs Early: Fixing minor issues before they escalate (i.e. roof leaks, electrical problems, or foundation cracks) can prevent costly claims.
- Upgrade Key Systems: Replacing old plumbing (i.e. knob-and-tube, galvanized piping) or electrical wiring can reduce your risk profile and even lead to discounts.
- Ask for a Maintenance Inspection: Some insurers or brokers offer home assessments that can help identify red flags.
- Bundle and Compare Quotes: Bundle your home and auto insurance, and consider using comparison platforms such as MyChoice to obtain rates from multiple providers. Most insurers will price your home and risk differently.
Raw Provincial Data:
| Province | % of Homes Needing Major Repairs | % of Homes Built Before 1960 | Renovation Inflation (2024-2025) | Home Insurance Inflation (2024-2025) |
|---|---|---|---|---|
| Newfoundland and Labrador | 7.41% | 17.82% | 3.18% | 4.51% |
| PEI | 10.55% | 20.44% | n/a | 0.69% |
| Nova Scotia | 10.90% | 17.55% | 2.87% | 7.15% |
| New Brunswick | 9.88% | 22.07% | 1.07% | -0.25% |
| Quebec | 7.40% | 31.02% | 3.42% | 2.35% |
| Ontario | 7.01% | 20.31% | 0.48% | 7.15% |
| Manitoba | 8.86% | 26.23% | 3.29% | 6.67% |
| Saskatchewan | 8.52% | 19.19% | 4.95% | 4.02% |
| Alberta | 6.32% | 9.87% | 3.55% | 9.37% |
| British Columbia | 6.75% | 9.61% | 2.47% | 5.89% |
Raw City-level Data:
| City | % of Homes Needing Major Repairs | % of Homes Built Before 1960 | Renovation Inflation (2024-2025) | Home Insurance Inflation (2024-2025) |
|---|---|---|---|---|
| Moncton | 8.81% | 15.80% | +1.07% | +1.23% |
| Winnipeg | 8.81% | 26.01% | +3.29% | +5.37% |
| Regina | 7.45% | 17.85% | +6.74% | +12.28% |
| Montreal | 7.38% | 23.89% | +3.14% | +3.21% |
| Halifax | 6.86% | 11.77% | +2.87% | +2.46% |
| Ottawa-Gatineau | 6.60% | 20.37% | +2.65% | +14.30% |
| Toronto | 6.59% | 12.96% | +0.19% | +8.12% |
| Edmonton | 6.43% | 9.32% | +3.31% | -1.03% |
| London | 6.36% | 19.82% | +4.73% | +12.15% |
| Saskatoon | 6.10% | 14.80% | +4.13% | +6.10% |
| Hamilton | 6.06% | 24.11% | n/a | +2.83% |
| Vancouver | 5.89% | 7.38% | +1.91% | +9.94% |
| Quebec City | 5.09% | 20.61% | +6.29% | +3.32% |
| St. John’s | 4.86% | 13.38% | +3.18% | +4.43% |
| Kitchener- Waterloo | 4.75% | 14.55% | n/a | -0.30% |
| Calgary | 4.32% | 6.79% | +3.63% | -2.33% |