







MyChoice Reveals the Top 15 Cities With Best and Worst Kept Homes in Ontario
As of December 2023, the financial landscape for homeowners has seen drastic changes. With HELOC rates now exceeding 7.5% – a stark increase from the historical low of 2.35% in 2021, households are finding it increasingly challenging to manage maintenance costs. Moreover, with the Bank of Canada showing little sign of reducing rates in Q1 of 2024, Ontarians are cautioned that the reduced capacity for minor repairs could lead to more significant issues in their homes.
Not all Ontario cities might fare equally when it comes to the types of home insurance rates experienced by Ontarians. We looked into this disparity a little further here at MyChoice by studying data from the 2021 Census. When it comes to “Major repairs needed”, meaning repairs to faulty plumbing or electrical systems, structural damage, and similar problems, Thunder Bay tops the province with 7.5% of households indicating that their home requires such repairs. At the other end of the spectrum is Vaughan, with only 2.5% of households reporting that their home requires major repairs.
“The upsurge in HELOC rates is just one piece of the puzzle. We’re seeing the inflation of home insurance rates in Canada. According to the Q3 Consumer Price Index, home and mortgage insurance rates have increased by 8.6% in 2023. The largest contributor to this would be rising home replacement costs due to inflation of building materials,” says Aren Mirzaian, CEO of MyChoice.
With the increase in natural disasters in Canada comes an increase in inflationary pressure on home insurance rates. Consequently, there are more claims being made, driving up premiums. It’s more important now than ever for homeowners to maintain their homes and not let minor issues turn into costly repairs.
“The connection between the state of home repairs and insurance costs cannot be overstated,” Mirzaian says. “If interest rates stay higher for longer in 2024, we could see a surge in insurance claims, which may contribute to the rising insurance premiums. It’s imperative for homeowners to stay vigilant about their home’s condition and make sure they have the appropriate level of insurance coverage.”
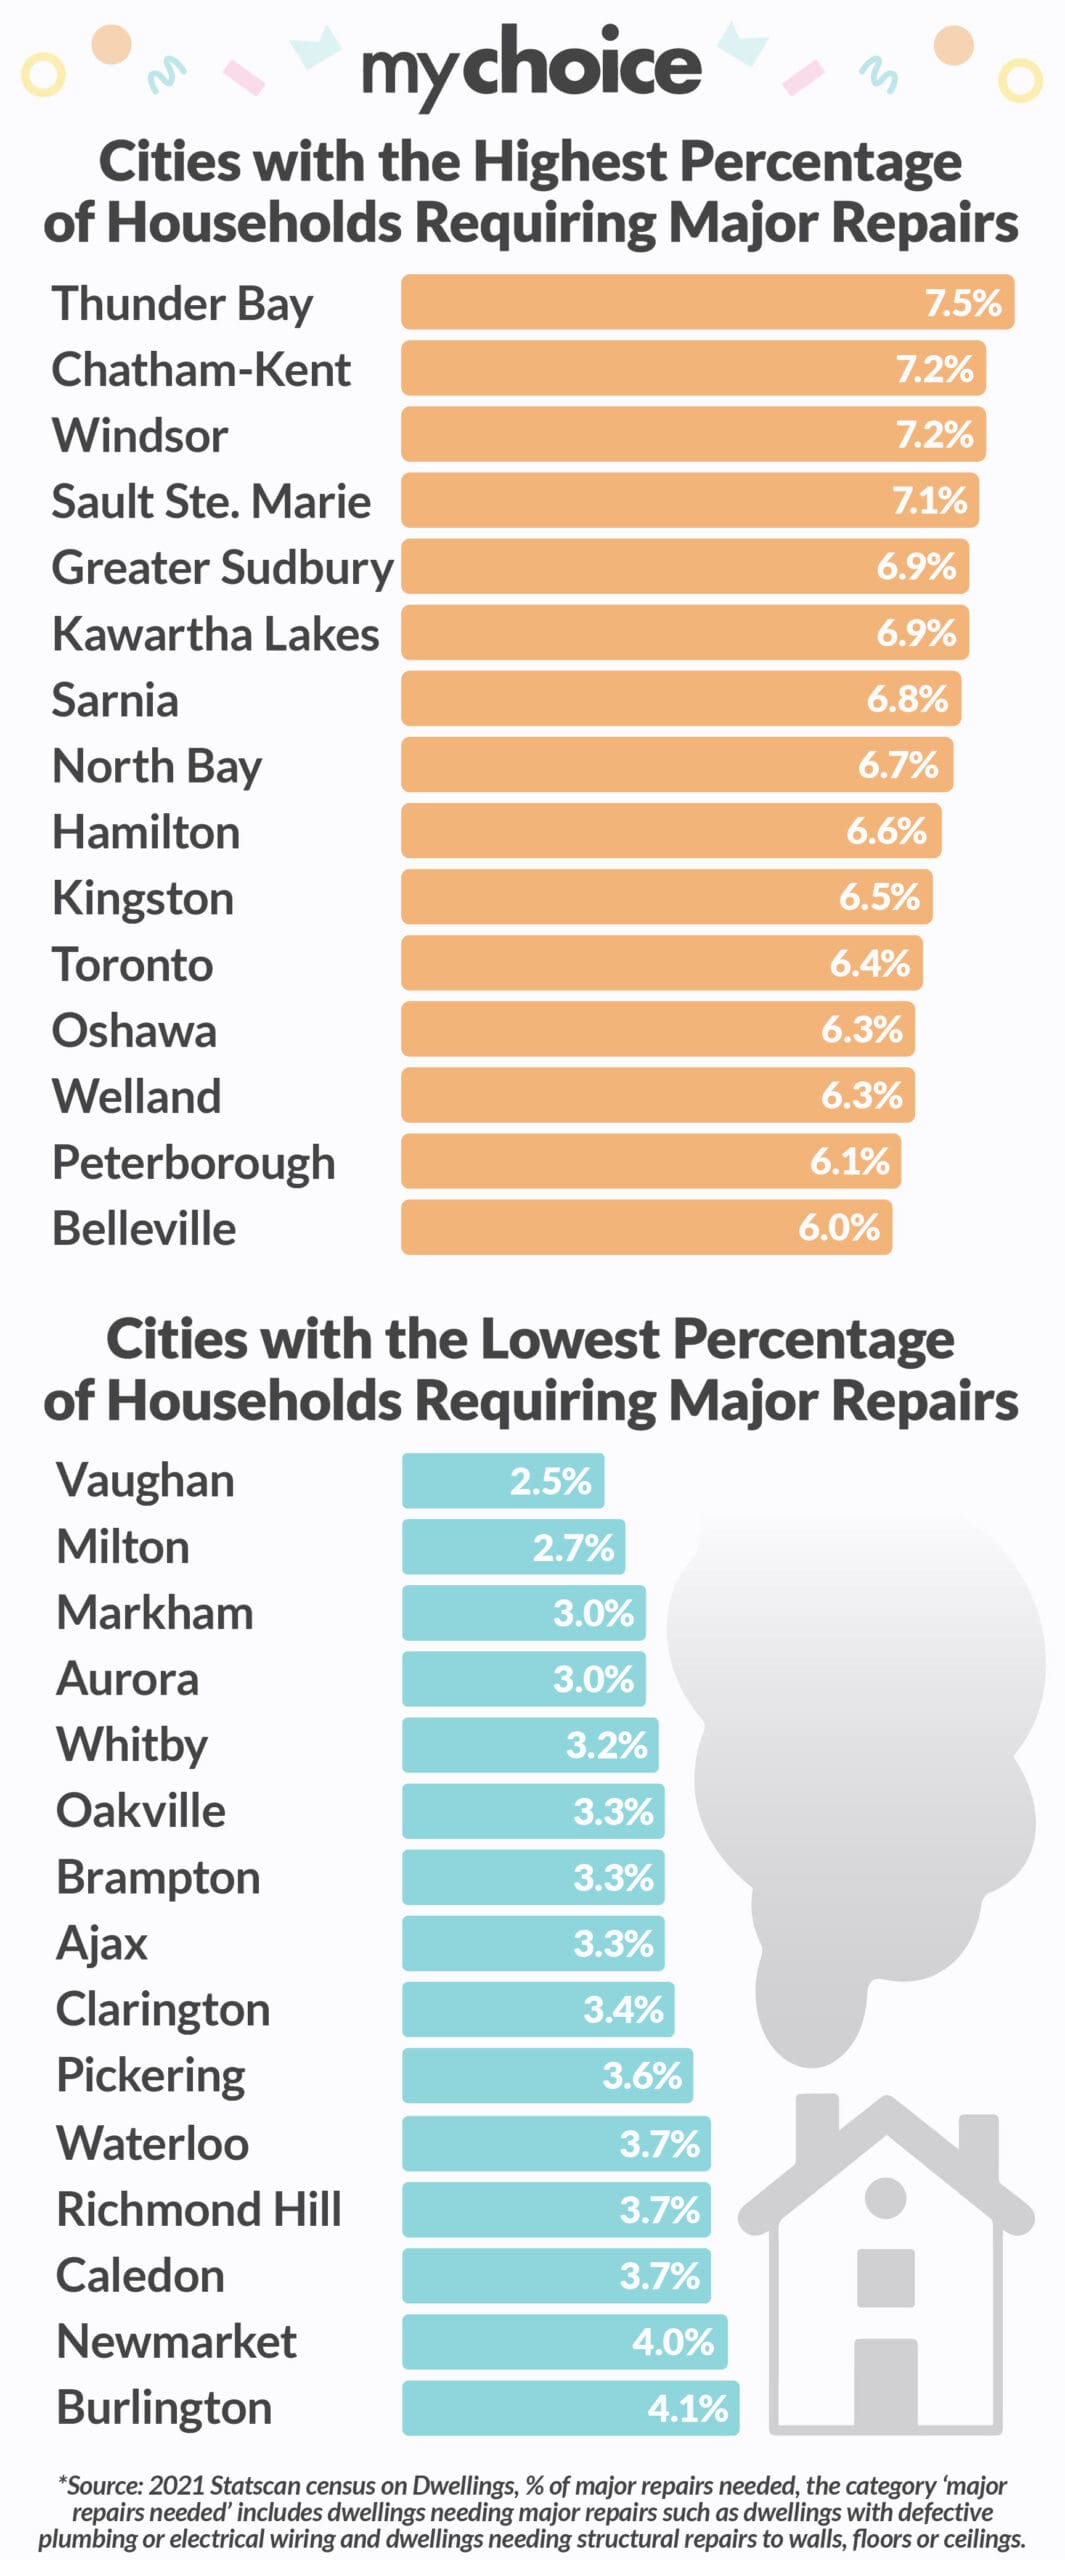
Raw Data for study:
| City | % of Homes with Major Repairs Required |
|---|---|
| Thunder Bay | 7.5 % |
| Chatham-Kent | 7.2 % |
| Windsor | 7.2 % |
| Sault Ste. Marie | 7.1 % |
| Greater Sudbury | 6.9 % |
| Kawartha Lakes | 6.9 % |
| Sarnia | 6.8 % |
| North Bay | 6.7 % |
| Hamilton | 6.6 % |
| Kingston | 6.5 % |
| Toronto | 6.4 % |
| Oshawa | 6.3 % |
| Welland | 6.3 % |
| Peterborough | 6.1 % |
| Belleville | 6.0 % |
| Brantford | 6.0 % |
| Norfolk County | 5.8 % |
| St. Catharines | 5.8 % |
| London | 5.5 % |
| Niagara Falls | 5.4 % |
| Ottawa | 5.4 % |
| Cambridge | 5.2 % |
| Mississauga | 4.8 % |
| Guelph | 4.7 % |
| Kitchener | 4.7 % |
| Barrie | 4.6 % |
| Halton Hills | 4.4 % |
| Burlington | 4.1 % |
| Newmarket | 4.0 % |
| Caledon | 3.7 % |
| Richmond Hill | 3.7 % |
| Waterloo | 3.7 % |
| Pickering | 3.6 % |
| Clarington | 3.4 % |
| Ajax | 3.3 % |
| Brampton | 3.3 % |
| Oakville | 3.3 % |
| Whitby | 3.2 % |
| Aurora | 3.0 % |
| Markham | 3.0 % |
| Milton | 2.7 % |
| Vaughan | 2.5 % |
*Source: 2021 Statscan census on Dwellings, % of major repairs needed, The category ‘major repairs needed’ includes dwellings needing major repairs such as dwellings with defective plumbing or electrical wiring and dwellings needing structural repairs to walls, floors or ceilings.