









Obesity is becoming one of the biggest health problems in Canada. Statistics Canada data show an increase in the estimated number of Canadian adults classified as having obesity between 2020 and 2022.
Rising obesity levels are not just a public health issue. This article examines how BMI may affect life insurance underwriting and premiums.
Key Findings
- The estimated number of Canadian adults classified as having obesity increased by 10.9% from 2020 to 2022.
- The estimated number among adults aged 18 to 34 increased by 19.3%, the largest percentage increase among the age groups shown.
- The estimated number increased by 11.9% for women and 9.9% for men.
- Insurers may consider BMI during the underwriting process, along with other health information.
- A higher BMI doesn’t necessarily mean you won’t be eligible for life insurance.
What Classifies Obesity in This Study?
For the purpose of these Statistics Canada tables, an adult with a BMI of 30 or higher is classified as having obesity. This includes obesity classes I to III.
Statistics Canada adjusts self-reported height and weight data to account for misreporting. BMI is a population-level screening tool and is not a direct measure of body fat.
Obesity in Canada: Estimated Population Changes
The estimated number of Canadian adults classified as having obesity rose from about 7.85 million to 8.71 million between 2020 and 2022, an increase of 10.9%.
Estimated Population by Province, 2020–2022
| Province | 2020 estimated population | 2022 estimated population | Change in estimated count | Percentage increase |
|---|---|---|---|---|
| New Brunswick | 220,500 | 264,500 | +44,000 | 20.0% |
| Manitoba | 280,700 | 323,900 | +43,200 | 15.4% |
| British Columbia | 909,300 | 1,041,200 | +131,900 | 14.5% |
| Saskatchewan | 273,800 | 313,100 | +39,300 | 14.4% |
| Ontario | 3,050,800 | 3,374,900 | +324,100 | 10.6% |
| Quebec | 1,700,400 | 1,872,700 | +172,300 | 10.1% |
| Alberta | 942,700 | 1,018,100 | +75,400 | 8.0% |
| Nova Scotia | 260,400 | 278,200 | +17,800 | 6.8% |
| Prince Edward Island | 44,400 | 46,700 | +2,300 | 5.2% |
| Newfoundland and Labrador | 169,300 | 172,300 | +3,000 | 1.8% |
The Estimated Increase Was Greater Among Women
The estimated number of adults classified as having obesity increased for both men and women from 2020 to 2022, but the increase was greater among women.
| Sex | 2020 estimated population | 2022 estimated population | Change in estimated count | Percentage increase |
|---|---|---|---|---|
| Females | 3,877,900 | 4,338,100 | +460,200 | 11.9% |
| Males | 3,974,300 | 4,367,400 | +393,100 | 9.9% |
Young Adults Had the Largest Percentage Increase
| Age group | 2020 estimated population | 2022 estimated population | Change in estimated count | Percentage increase |
|---|---|---|---|---|
| 18 to 34 years | 1,618,000 | 1,930,000 | +312,000 | 19.3% |
| 65 years and over | 1,670,600 | 1,914,900 | +244,300 | 14.6% |
| 35 to 49 years | 2,202,700 | 2,390,200 | +187,500 | 8.5% |
| 50 to 64 years | 2,360,900 | 2,470,400 | +109,500 | 4.6% |
The estimated count for adults aged 18 to 34 had the largest percentage increase among the groups shown.
How BMI May Affect Life Insurance
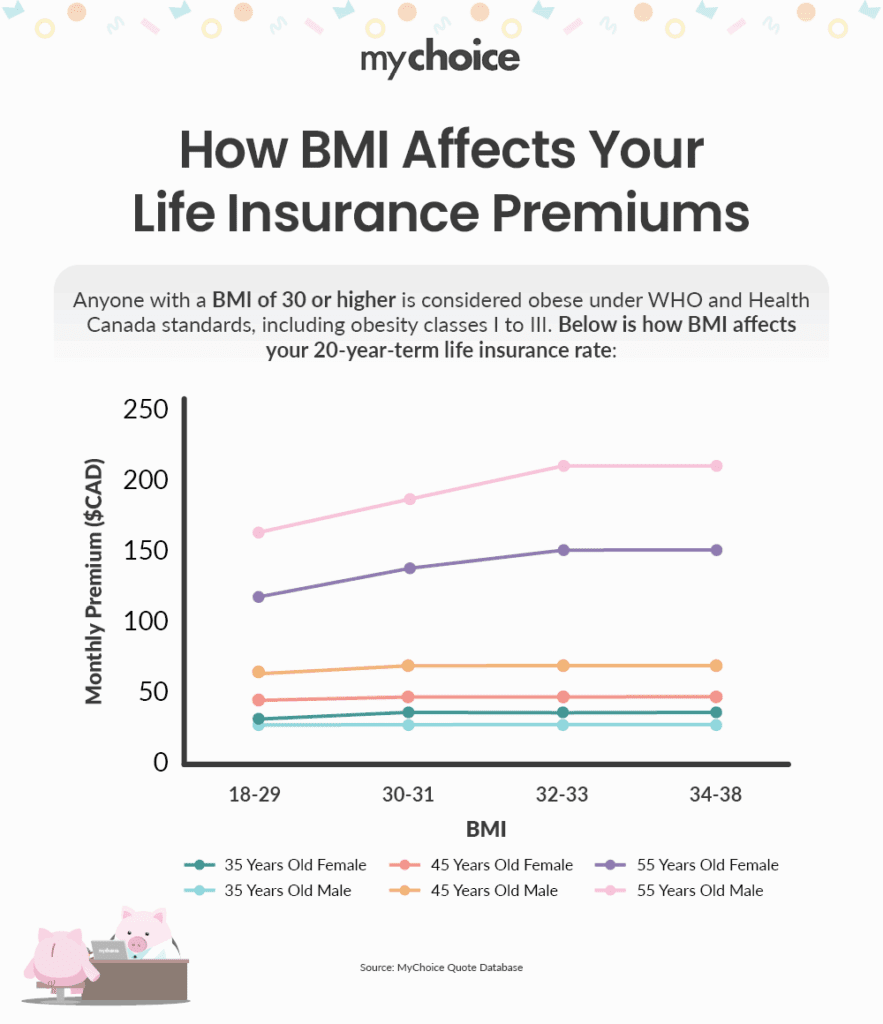
You may still be able to obtain life insurance with a higher-than-average BMI, although it could affect the premium offered. Insurers may also consider blood pressure, diabetes and other health information.
Life Insurance Pricing Based on BMI
| BMI Range | Gender | Term-20 Life Insurance (35-year-old) | Term-20 Life Insurance (45-year-old) | Term-20 Life Insurance (55-year-old) |
|---|---|---|---|---|
| 18–29 | Male | $28.80 | $63.45 | $161.10 |
| Female | $22.05 | $48.60 | $115.20 | |
| 30–31 | Male | $30.15 | $69.75 | $187.20 |
| Female | $22.05 | $49.95 | $133.65 | |
| 32–33 | Male | $30.15 | $69.75 | $213.30 |
| Female | $22.05 | $49.95 | $152.10 | |
| 34–38 | Male | $30.15 | $69.75 | $213.30 |
| Female | $22.05 | $49.95 | $152.10 |
Read More: Learn About Life Insurance for Young Adults