









Statistics Canada’s modelling of life expectancy and healthy life expectancy using 2019 and 2020 figures shows wide variations between municipalities. But the 14-year gap between the highest- and lowest-ranking municipalities does not predict what would happen to an individual who moved from one municipality to another.
Our MyChoice team has taken a look at Statistics Canada’s municipal life-expectancy and health-adjusted life-expectancy study, as well as the Financial Consumer Agency of Canada’s guide to factors that affect insurance needs and cost to see what the gaps in life expectancy actually look like.
Can Where You Live Shorten Your Life By 14 Years?
Not exactly. The study shows a roughly 14-year gap in life expectancy between modelled municipal averages. It does not necessarily mean that if you were to move from a municipality at the 5th percentile of life expectancy at birth to a municipality at the 95th percentile of life expectancy at birth, your own life expectancy at birth would change by 12.5 years if you’re a woman and by 13.9 years if you’re a man, and similarly that your healthy-life-expectancy could change by 13.0 and 13.9 years respectively.
Factors including your health and income level, education, employment, housing, behaviours, age, access to health care etc., can lead your own life expectancy and healthy-life-expectancy to deviate from the average in a given municipality.
How Statistics Canada Estimated Municipal Life Expectancy
Life expectancy (LE) is the number of years that a newborn could be expected to live. Health-adjusted life expectancy (HALE) is the number of years a newborn could be expected to live in good health. The share of life in good health is the number of healthy years expressed as a percentage of expected years of life (HALE/LE). HALE takes into account both mortality and a measure of the quality of life, or health.
These indicators cannot be used to predict a person’s life expectancy, nor can they be used to create an insurance risk score. Similarly, HALE does not predict at what age everyone would be affected by a chronic condition, become ill or stop working. These are simply useful tools that allow us to have a modelled estimate of LE and HALE at the municipal level.
Who Was Included And Excluded
| Study step | Published detail | Why it matters |
|---|---|---|
| Starting geography | 5,161 census subdivisions had population data | These data represent the data pool, not the final analytic sample. |
| Low-data exclusion | 999 were excluded for insufficient person-years | Small-area estimates need enough information. |
| Missing-data exclusion | 2,815 were excluded for missing or zero model inputs | For a number of areas, no estimate was reported. |
| Final sample | 1,227 subdivisions | Results from this analysis are not necessarily generalizable to all subdivisions. |
| Population coverage | About 92% of the population and 93% of deaths | Fewer places are included but those places cover most of the population. |
| Period | 2019 and 2020 | The estimates are reflective of a time period with unusual mortality conditions. |
Where Major Canadian Cities Sit On The Life Expectancy Curve
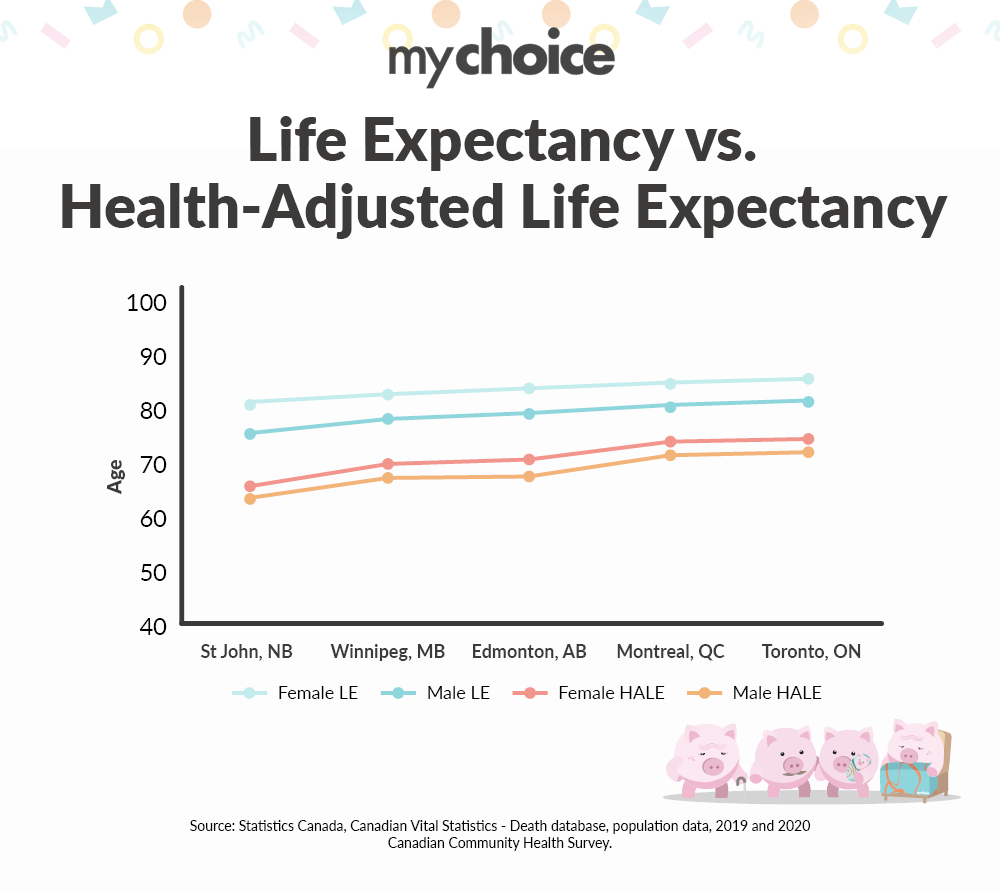
| Municipality | Women LE | Men LE | Women HALE | Men HALE |
|---|---|---|---|---|
| Saint John | 81.0 | 75.8 | 65.5 | 62.9 |
| Winnipeg | 83.2 | 78.5 | 69.5 | 67.2 |
| Edmonton | 84.2 | 79.3 | 70.0 | 67.4 |
| Montréal | 84.8 | 80.5 | 74.1 | 71.8 |
| Toronto | 86.8 | 81.5 | 73.7 | 70.8 |
Statistics Canada says that the median for its life expectancy estimates is 84.1 for women and 79.6 for men. Edmonton and Hamilton are examples of cities close to the national median for women, and Gatineau and Kitchener are two that are close to the median for men. The estimates aren’t a best-to-worst ranking, just examples of cities.
Read More: Read How Rising Life Expectancy Can Affect Life Insurance
How Much Confidence Should You Put In A Small-Area Estimate?
Although these models can be useful when direct estimates are highly unstable, these estimates should be used with an understanding of the limitations of the modelling approach. Validation showed greater agreement for LE than for HALE; however, some estimates were quite different, e.g., direct survey-weighted estimate of HALE for males in Sarnia was 57.8 years and the modelled estimate was 65.8 years, representing a difference of eight years.
Local area estimates should not be used as individual-level predictions. Estimates should be interpreted within the context of the methods and uncertainty.
Education Had The Strongest Reported Correlation With Life Expectancy
The values in this table are Kendall rank correlations. Positive values indicate that municipalities that rank higher for the characteristic also tend to rank higher for the health outcome. Negative values indicate that municipal rankings go in opposite directions for the characteristic and health outcome. Values closer to zero indicate a weaker association.
Suppose a characteristic had a Kendall rank correlation with life expectancy of 0.24. That number doesn’t mean that an increase in the characteristic leads to an increase of 0.24 years of life expectancy. It does indicate that communities ranked higher for the characteristic consistently rank higher for life expectancy too, in this case across all 1,227 communities in Canada.
Correlation With Life Expectancy (LE) At Birth
| Municipal Characteristic | Women | Men |
|---|---|---|
| % with Postsecondary Education | 0.24 * | 0.27 * |
| Population Size | 0.12* | 0.12* |
| Average After-Tax Income | 0.11* | 0.11* |
| Population Density | −0.04 | −0.04* |
Of the four characteristics that were compared, postsecondary education has the strongest positive correlation with life expectancy. However, the table doesn’t indicate how much lifespan might be affected by any one factor, nor does it control for other influences.
Correlation With Healthy Life Expectancy (HALE) At Birth
| Municipal Characteristic | Women | Men |
|---|---|---|
| % with Postsecondary Education | 0.35 * | 0.36 * |
| Population Size | 0.10* | 0.11* |
| Income | 0.03 | 0.04 |
| Population Density | 0.01 | 0.01 |
While the correlation of education is stronger with HALE than LE, the correlations of income and density are close to zero. We cannot infer, however, from this table that income and density do not have an effect on health in all circumstances.
Correlation With % Of Life Spent In Good Health
| Municipal Characteristic | Women (τ) | Men (τ) |
|---|---|---|
| % with Postsecondary Education | 0.32 * | 0.34 * |
| Population Density | 0.06* | 0.10* |
| Income | −0.07* | −0.07* |
| Population Size | −0.02 | 0.00 |
This negative correlation is quite small and cannot support the conclusion that higher incomes lead to poorer health. However, if it continues to exist, it may reflect the age profiles and demographics of the municipalities, factors not isolated in the above table.
The Estimated Gaps Were Larger For Men
The estimated 5th-to-95th-percentile LE and HALE gaps were larger for men (13.9 years for LE and 13.9 years for HALE) than for women, at 12.5 years for LE and 13.0 years for HALE. These estimates do not explain why the gap was larger for men; they only show the spread of modelled LE and HALE estimates per municipality.
What The Findings Do And Do Not Mean For Life Insurance
LE and HALE estimates for your municipality won’t help you figure out if you’re eligible for life insurance or how much it’ll cost you. The federal consumer guide doesn’t identify LE or HALE for municipalities as factors insurers use to determine who gets coverage or how much they pay for it. Depending on the product and applicable law, insurers do consider other factors such as your age, health history, tobacco use, and the amount of coverage sought when deciding whether to provide coverage and how much it’ll cost.
Read More: See How Life Insurance Coverage Falls Short Across Canada