







Wildfire-Related Losses in Canada Surge 740% Over the Last Decade
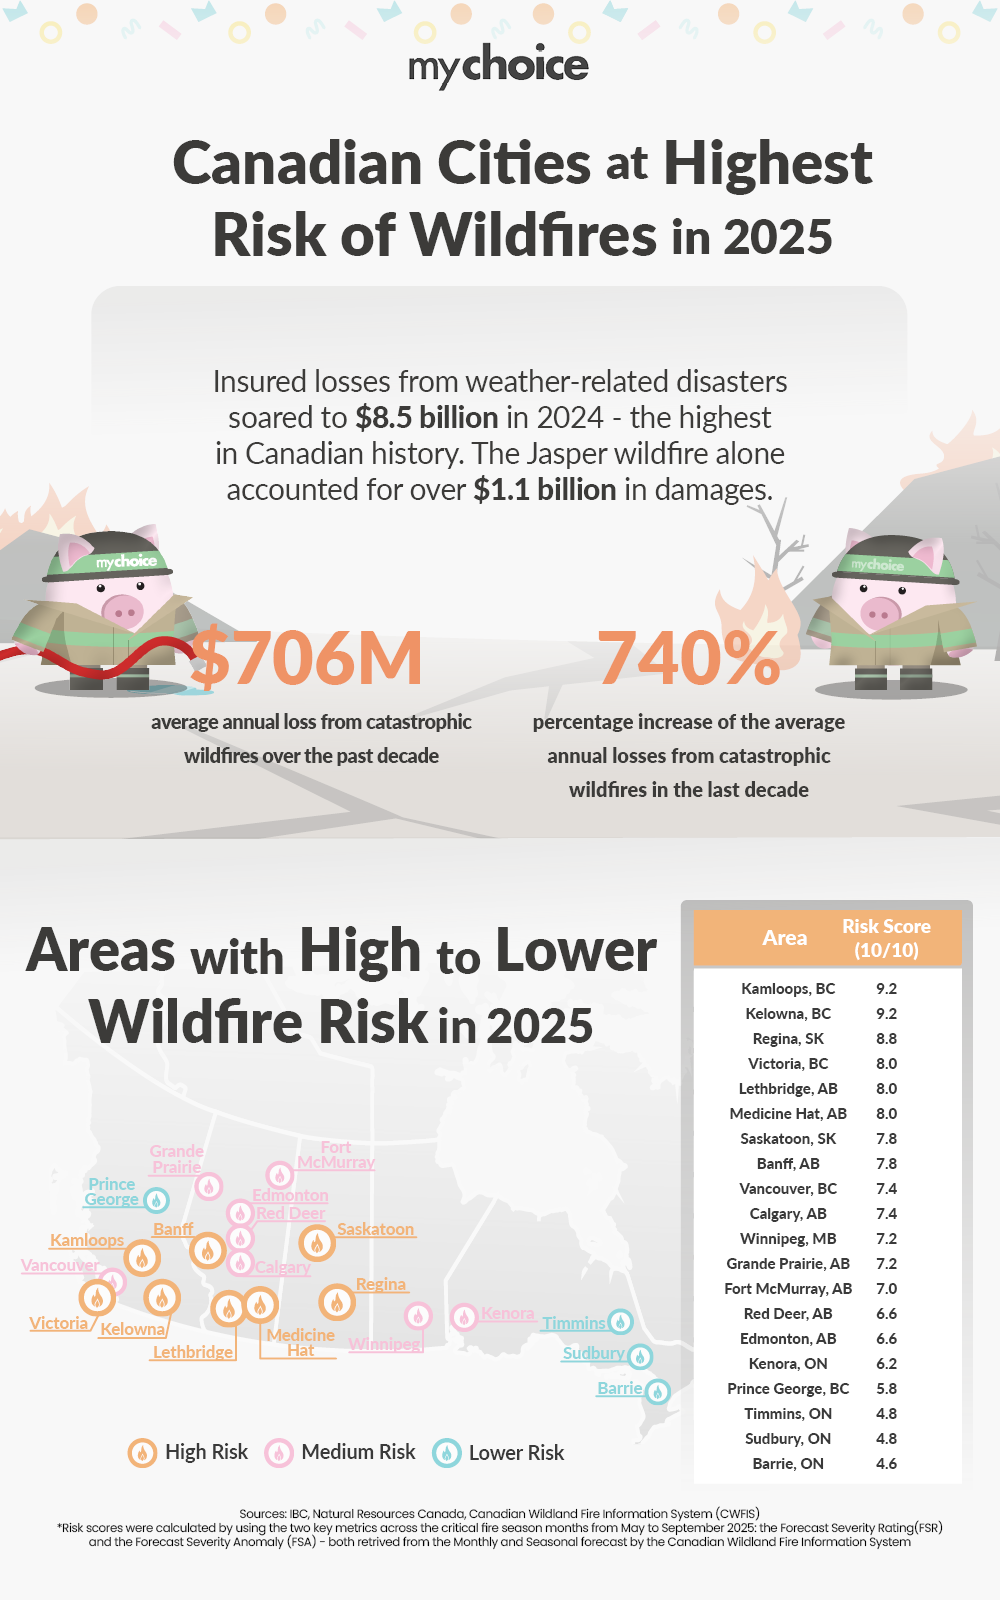
The 2025 wildfire season in Canada has already begun with a wave of fires in British Columbia, triggering partial evacuations in parts of Fort St. John. This comes on the heels of a record-breaking year in 2024, when insured losses from weather-related disasters soared to $8.5 billion — the highest in Canadian history. The Jasper wildfire alone accounted for over $1.1 billion in damages. What were once considered rare, one-in-100-year events are now happening with alarming regularity, driving the average annual loss from catastrophic wildfires to $706 million over the past decade — a staggering 740% increase from the previous ten-year period.
As threats continue to escalate, MyChoice, a leading Canadian Insurtech company has carried out a comprehensive study that reveals the regions that are likely to experience the most significant wildfire risk in 2025.
To determine city-level risk scores, we analyzed two key indicators across the core wildfire season from May to September: the Forecast Severity Rating (FSR) and the Forecast Severity Anomaly (FSA), both sourced from the Canadian Wildland Fire Information System’s monthly and seasonal forecasts. FSR gauges the predicted intensity of wildfire conditions while FSA compares the forecasted severity to historical norms. Each city’s overall risk score was calculated by averaging the monthly FSR and FSA values from May through September, providing a comprehensive picture of where wildfire risk is expected to be most severe in 2025.
Key Findings from the Study:
- Kamloops, BC, once again tops the list as Canada’s most wildfire-vulnerable city in 2025, with a risk score of 9.2/10, down slightly from 9.4 relative to last year’s report. While its overall risk declined marginally, it remains extremely elevated due to consistently severe anomalies and fire weather conditions.
- Kelowna, BC is expected to be among those facing the greatest risk this year. Kelowna’s final score of 9.2 is an increase from its score of 8.6 from last year, a result of more consistent anomalies throughout the season and a forecast of greater severity.
- Regina, SK climbed to 8.8 from 8.6 in 2024, driven by slightly more intense forecast anomalies and steady severe fire weather indicators.
- Wildfire risk in Saskatoon, SK has gone down this year, with an index of 7.8, compared to 8.8. This is due to FSA forecast conditions in July and September being less severe.
- Medicine Hat, AB is down slightly at 8.0, compared to 8.6 last year, indicating a slight softening in anticipated fire conditions.
- Lethbridge, AB also declined, scoring 8.0 versus 8.4 in 2024, but remains one of the higher-risk areas in Alberta due to consistent fire severity levels.
- The good news is that anomalies were less severe this season – Grande Prairie, AB was 7.2, as opposed to 8.4 last year.
- Fort McMurray, AB declined to 7.0 from 8.0, suggesting improved short-term outlooks for burn potential in late summer.
- Winnipeg, MB had a score of 7.2, which is a minor drop from 7.8 and is still in the moderate-high risk category.
- Edmonton, AB slightly decreased to 6.6 from 7.0, with risk profile relatively stable on a yearly basis.
- The largest improvement in risk scores (from 7.4 in 2024 to 5.8 in 2025) was observed in Prince George, BC. More moderate FSA scores during the mid-to-late summer were the largest contributor to the improvement.
- Calgary, AB is at 7.4, the same as in the previous year. Expected fire risk is comparable to last year’s level.
- Red Deer, AB increased to 6.6 from 5.8, suggesting some worsening of short-term fire conditions in the region.
- Kenora, ON saw an increased risk of wildfires, scoring 6.2 in 2025, up from 5.4 in 2024.
- Most Ontario cities, like Timmins, Sudbury, and Barrie, remain on the lower end of the wildfire risk scale, with scores ranging from 4.8 to 4.6. These scores are largely consistent with 2024, showing no significant upward or downward movement.
While Canada’s insurance market has so far avoided the full-blown crisis seen in California, the warning signs are clear. The recent LA wildfires caused an estimated $250 billion in damages and pushed over 800,000 homes into an uninsured state, highlighting the consequences of regulatory gridlock, delayed resilience measures, and insurers exiting high-risk zones. Canada’s open insurance market and competitive environment have helped maintain access to coverage, but we’re starting to see cracks. Aviva’s decision to withdraw its direct-to-consumer business from Alberta in early 2025 mirrors the early stages of insurer retreat seen in California. With average annual wildfire losses in Canada surging from $84 million to $706 million over the past decade, and major fires like Jasper pushing losses into the billions, Canadian policymakers can no longer afford to treat the California experience as distant. Proactive adaptation – not pricing restrictions – will be key to maintaining a healthy, responsive insurance market.
Reinsurance has taken centre stage in 2025, acting as a key buffer against the growing volatility of extreme loss events. Global reinsurer capital climbed to a record USD $715 billion in Q3 2024, up $45 billion from the end of 2023, driven by recovering asset values, retained earnings, and heightened activity in the catastrophe bond market. Much of this growth stemmed from market rebounds rather than fresh capital inflows, reflecting ongoing investor caution around climate-related risks. In Canada, where 2024 marked the costliest year for catastrophe claims, most reinsurance programs were triggered. In response, reinsurers tightened terms: loss-affected programs saw risk-adjusted rate hikes between 10% and 40%, and appetite for low-attaching layers remained constrained.
Aren Mirzaian, CEO of MyChoice, comments on what homeowners can do at the consumer level: “After a year like 2024, where wildfire losses in Canada reached unprecedented levels, preparation is more important than ever,” said Mirzaian. “While insurers and reinsurers are adjusting to rising climate risks, homeowners can take practical steps to reduce their exposure. Clearing dry brush, trimming trees to maintain distance from the home, installing fire-resistant roofing and siding, and storing flammable materials away from structures can go a long way. Not only do these measures help protect your property, but they also strengthen your position when it comes to securing affordable insurance in high-risk areas.”
We have designated areas of high risk for wildfires. If you live in a high risk area, it’s important to make sure you have a comprehensive insurance policy that includes: – Coverage for damage from a wildfire – Coverage for additional living expenses – Coverage for emergency evacuation costs – Replacement cost coverage for your house, which would allow you to rebuild a similar-quality, similar-size home – Contents coverage, which would allow you to replace your possessions.
Raw Data:
FSA Score | FSR Score | ||||||||||
| May | June | July | Aug | Sept | May | June | July | Aug | Sept | Total | |
| Kamloops, BC | 5 | 5 | 5 | 5 | 5 | 4 | 4 | 4 | 4 | 5 | 9.2 |
| Kelowna, BC | 4 | 5 | 5 | 5 | 5 | 4 | 4 | 4 | 5 | 5 | 9.2 |
| Regina, SK | 5 | 5 | 4 | 5 | 5 | 4 | 4 | 4 | 4 | 4 | 8.8 |
| Victoria, BC | 1 | 3 | 4 | 5 | 4 | 3 | 5 | 5 | 5 | 5 | 8 |
| Lethbridge, AB | 3 | 3 | 4 | 5 | 4 | 4 | 4 | 4 | 4 | 5 | 8 |
| Medicine Hat, AB | 4 | 3 | 4 | 4 | 4 | 4 | 4 | 4 | 4 | 5 | 8 |
| Saskatoon, SK | 4 | 4 | 3 | 4 | 4 | 4 | 4 | 4 | 4 | 4 | 7.8 |
| Banff, AB | 3 | 3 | 3 | 4 | 4 | 4 | 4 | 4 | 5 | 5 | 7.8 |
| Vancouver, BC | 1 | 2 | 4 | 5 | 3 | 3 | 4 | 5 | 5 | 5 | 7.4 |
| Calgary, AB | 3 | 2 | 3 | 4 | 4 | 4 | 4 | 4 | 4 | 5 | 7.4 |
| Winnipeg, MB | 3 | 3 | 3 | 4 | 3 | 3 | 4 | 4 | 5 | 4 | 7.2 |
| Grande Prairie, AB | 3 | 3 | 3 | 3 | 3 | 4 | 4 | 4 | 4 | 5 | 7.2 |
| Fort McMurray, AB | 3 | 3 | 3 | 3 | 3 | 4 | 4 | 4 | 4 | 4 | 7 |
| Red Deer, AB | 3 | 3 | 2 | 4 | 2 | 4 | 3 | 4 | 4 | 4 | 6.6 |
| Edmonton, AB | 4 | 3 | 2 | 3 | 2 | 4 | 3 | 3 | 5 | 4 | 6.6 |
| Kenora, ON | 2 | 2 | 2 | 3 | 2 | 3 | 4 | 4 | 5 | 4 | 6.2 |
| Prince George, BC | 2 | 1 | 3 | 3 | 2 | 3 | 4 | 4 | 4 | 3 | 5.8 |
| Timmins, ON | 1 | 2 | 2 | 2 | 1 | 3 | 3 | 3 | 4 | 3 | 4.8 |
| Sudbury, ON | 1 | 2 | 2 | 2 | 1 | 3 | 3 | 3 | 4 | 3 | 4.8 |
| Barrie, ON | 1 | 2 | 2 | 2 | 1 | 3 | 3 | 3 | 3 | 3 | 4.6 |
Source: Natural Resources Canada, Canadian Wildland Fire Information System
FSA Score: well below average – 1, below average – 2, average – 3, above average – 4, well above average – 5
Key: 1 = ‘low’, 2 = ‘moderate’, 3 = ‘high’, 4 = ‘very high’, 5 = ‘extreme’ FSR Score rating.