


Most Canadians Are Underinsured by 14.5%, Amid Soaring Household Debt
Canada’s financial vulnerability continues to deepen as household debt stays elevated, real estate remains historically expensive, and savings growth fails to keep pace with rising liabilities. In 2025, Canadian households carried a staggering $3.07 trillion in debt, marking the 15th consecutive year we lead the G7 in this metric.
In light of this concerning trend, our team at MyChoice, a leading Toronto-based insurtech company, conducted a study to evaluate whether Canadian families have sufficient life insurance coverage given their income, debt levels, and savings.
On paper, the numbers look reassuring. Canadians now report $5.8 trillion in life insurance coverage, 22 million policyholders nationwide, and an average household protection level of $509,000. But those headlines can be dangerously misleading because the real question is: Is that enough?
Methodology
To estimate how much life insurance Canadian households should carry in 2025, we analyzed the latest publicly available provincial-level data on household income, mortgage and non-mortgage debt, pension and non-pension assets from Statistics Canada and CMHC. For each province, we applied the formula: (household income × 7 years) + mortgage debt + non-mortgage debt – pension assets – non-pension assets to derive a “recommended coverage” value. We then compared that benchmark to the actual average life insurance coverage per household reported by the Canadian Life and Health Insurance Association (CLHIA) for insured households by province, highlighting the percentage gap between the recommended and actual coverage.
Key Findings
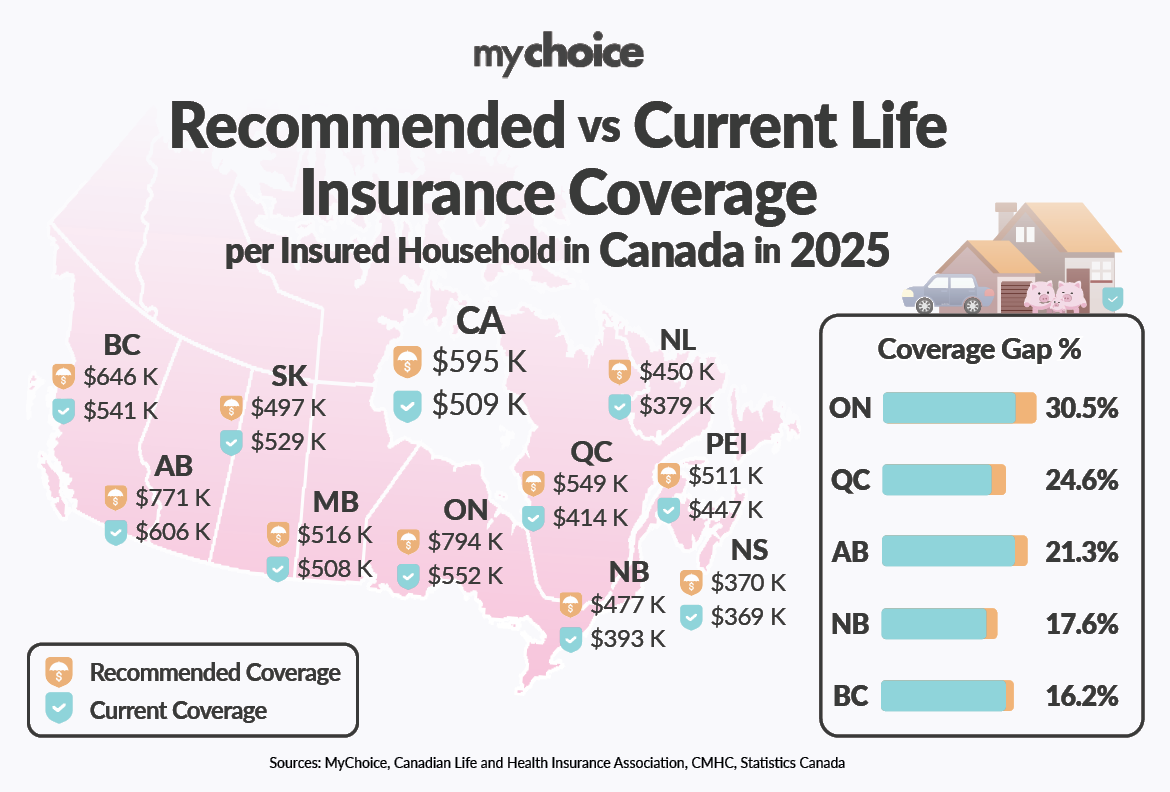
- Households in Ontario, Alberta, British Columbia, Quebec, and much of Atlantic Canada are now more under-insured than ever, despite rising incomes. As debt rises faster than assets, many Canadians are unknowingly leaving their families exposed to major financial risk.
- Ontario has the most significant coverage shortfall. Households need about $794,400 in life insurance coverage but hold an average of $552,000, leaving a 30.5% gap.
- Alberta shows a significant under-insurance gap of 21.3%, even though it has the highest average household income among provinces.
- Quebec’s gap stands at 24.6%, reflecting slower asset growth and rising household debt.
- Households in British Columbia require approximately $645,800 in life insurance coverage but hold an average of $541,000, leaving a 16.2% underinsurance gap.
- In Atlantic Canada, New Brunswick’s gap is 17.6%, and Newfoundland & Labrador’s gap is 15.8%, indicating rising risk in regions with lower household incomes.
- Manitoba and Nova Scotia are near balanced: Manitoba shows a small gap of 1.6%, and Nova Scotia only 0.4%, meaning average life insurance coverage roughly meets recommended levels.
- Nationally, the average recommended coverage is about $595,000, while the average actual coverage is $509,000, leaving a 14.5% protection shortfall across Canada.
What This Means for Canadians
“This year’s data shows a widening protection gap,” says Aren Mirzaian, CEO of MyChoice. “Many Canadians believe they’re adequately insured, but the numbers simply don’t support that claim. With rising household debt and other pressures, such as a softening job market, the average household is now further from sufficient coverage than it was even five years ago. Reviewing your life insurance isn’t optional anymore, it’s a critical pillar of long-term financial stability.“
For many Canadians, a single unexpected death could jeopardize:
- Their mortgage. Mortgage debt now accounts for roughly three-quarters of all household debt. Canada Mortgage and Housing Corporation
- Their children’s education. Insufficient coverage means families may be forced to reallocate savings or delay tuition payments.
- Long-term savings. When debt outpaces savings growth, households have little cushion left to protect.
- Retirement plans. The burden of repaying debt shifts the focus away from building retirement assets.
- Debt repayment obligations. High levels of consumer and mortgage debt leave less capacity to absorb a lost income stream.
At a time when financial vulnerability is rising, life insurance stops being an optional benefit and becomes a core component of a family’s financial resilience plan. Without adequate coverage, the economic consequences of an income-earner’s untimely passing become far larger than the immediate emotional loss.
Raw Data:
| Province | Average Household Income Before Taxes ($) | Average Mortgage Debt Value ($) | Average Non-Mortgage Debt ($) | Average Pension Assets Value ($) | Average Non-Pension Assets Value ($) | Approximate Coverage Needed ($) |
|---|---|---|---|---|---|---|
| British Columbia | 124,700 | 261,600 | 49,700 | 354,400 | 184,000 | 645,800 |
| Alberta | 137,800 | 267,900 | 51,200 | 343,000 | 170,200 | 770,500 |
| Ontario | 129,200 | 383,300 | 49,400 | 367,900 | 174,800 | 794,400 |
| Saskatchewan | 111,600 | 151,900 | 41,700 | 349,600 | 128,000 | 497,200 |
| Newfoundland and Labrador | 104,700 | 178,200 | 35,100 | 390,900 | 105,200 | 450,100 |
| Quebec | 105,400 | 219,300 | 29,300 | 315,800 | 121,300 | 549,300 |
| Manitoba | 107,900 | 208,300 | 35,400 | 364,300 | 118,400 | 516,300 |
| Prince Edward Island | 100,300 | 183,200 | 34,800 | 327,100 | 81,900 | 511,100 |
| New Brunswick | 95,100 | 133,800 | 42,700 | 303,000 | 62,200 | 477,000 |
| Nova Scotia | 99,100 | 122,400 | 35,200 | 387,100 | 93,800 | 370,400 |
| National Average | 120,400 | 211,500 | 43,500 | 349,000 | 153,800 | 595,000 |
Here’s how we approached the calculation for the recommended life insurance coverage:
Approximate Coverage Needed = (household income * 7 years) + average mortgage debt + average non-mortgage debt – pension assets – non-pension assets
*We multiplied household income by 7, a standard recommendation to account for the financial burden of losing seven years of income, ensuring the family has enough time to adjust to the loss.
Average mortgage and non-mortgage debt: This includes all major liabilities like mortgages, credit cards, loans, and lines of credit that a household may carry. Including these debts helps to ensure the life insurance coverage can settle these obligations.
Household savings: Pension assets include registered savings like RRSPs, RRIFs, and EPPs, while non-pension assets include financial vehicles such as TFSAs, stocks, bonds, and mutual funds.
| Province | Approximate Coverage Needed ($) | Average protection per insured household ($) | Coverage Gap % |
|---|---|---|---|
| British Columbia | 645,800 | 541,000 | 16.2% |
| Alberta | 770,500 | 606,000 | 21.3% |
| Ontario | 794,400 | 552,000 | 30.5% |
| Saskatchewan | 497,200 | 529,000 | -6.4% |
| Newfoundland and Labrador | 450,100 | 379,000 | 15.8% |
| Quebec | 549,300 | 414,000 | 24.6% |
| Manitoba | 516,300 | 508,000 | 1.6% |
| Prince Edward Island | 511,100 | 447,000 | 12.5% |
| New Brunswick | 477,000 | 393,000 | 17.6% |
| Nova Scotia | 370,400 | 369,000 | 0.4% |
| National Average | 595,000 | 509,000 | 14.5% |